
Figure 6. Uptake of BNT162b2 by DCs and macrophages in dLNs.
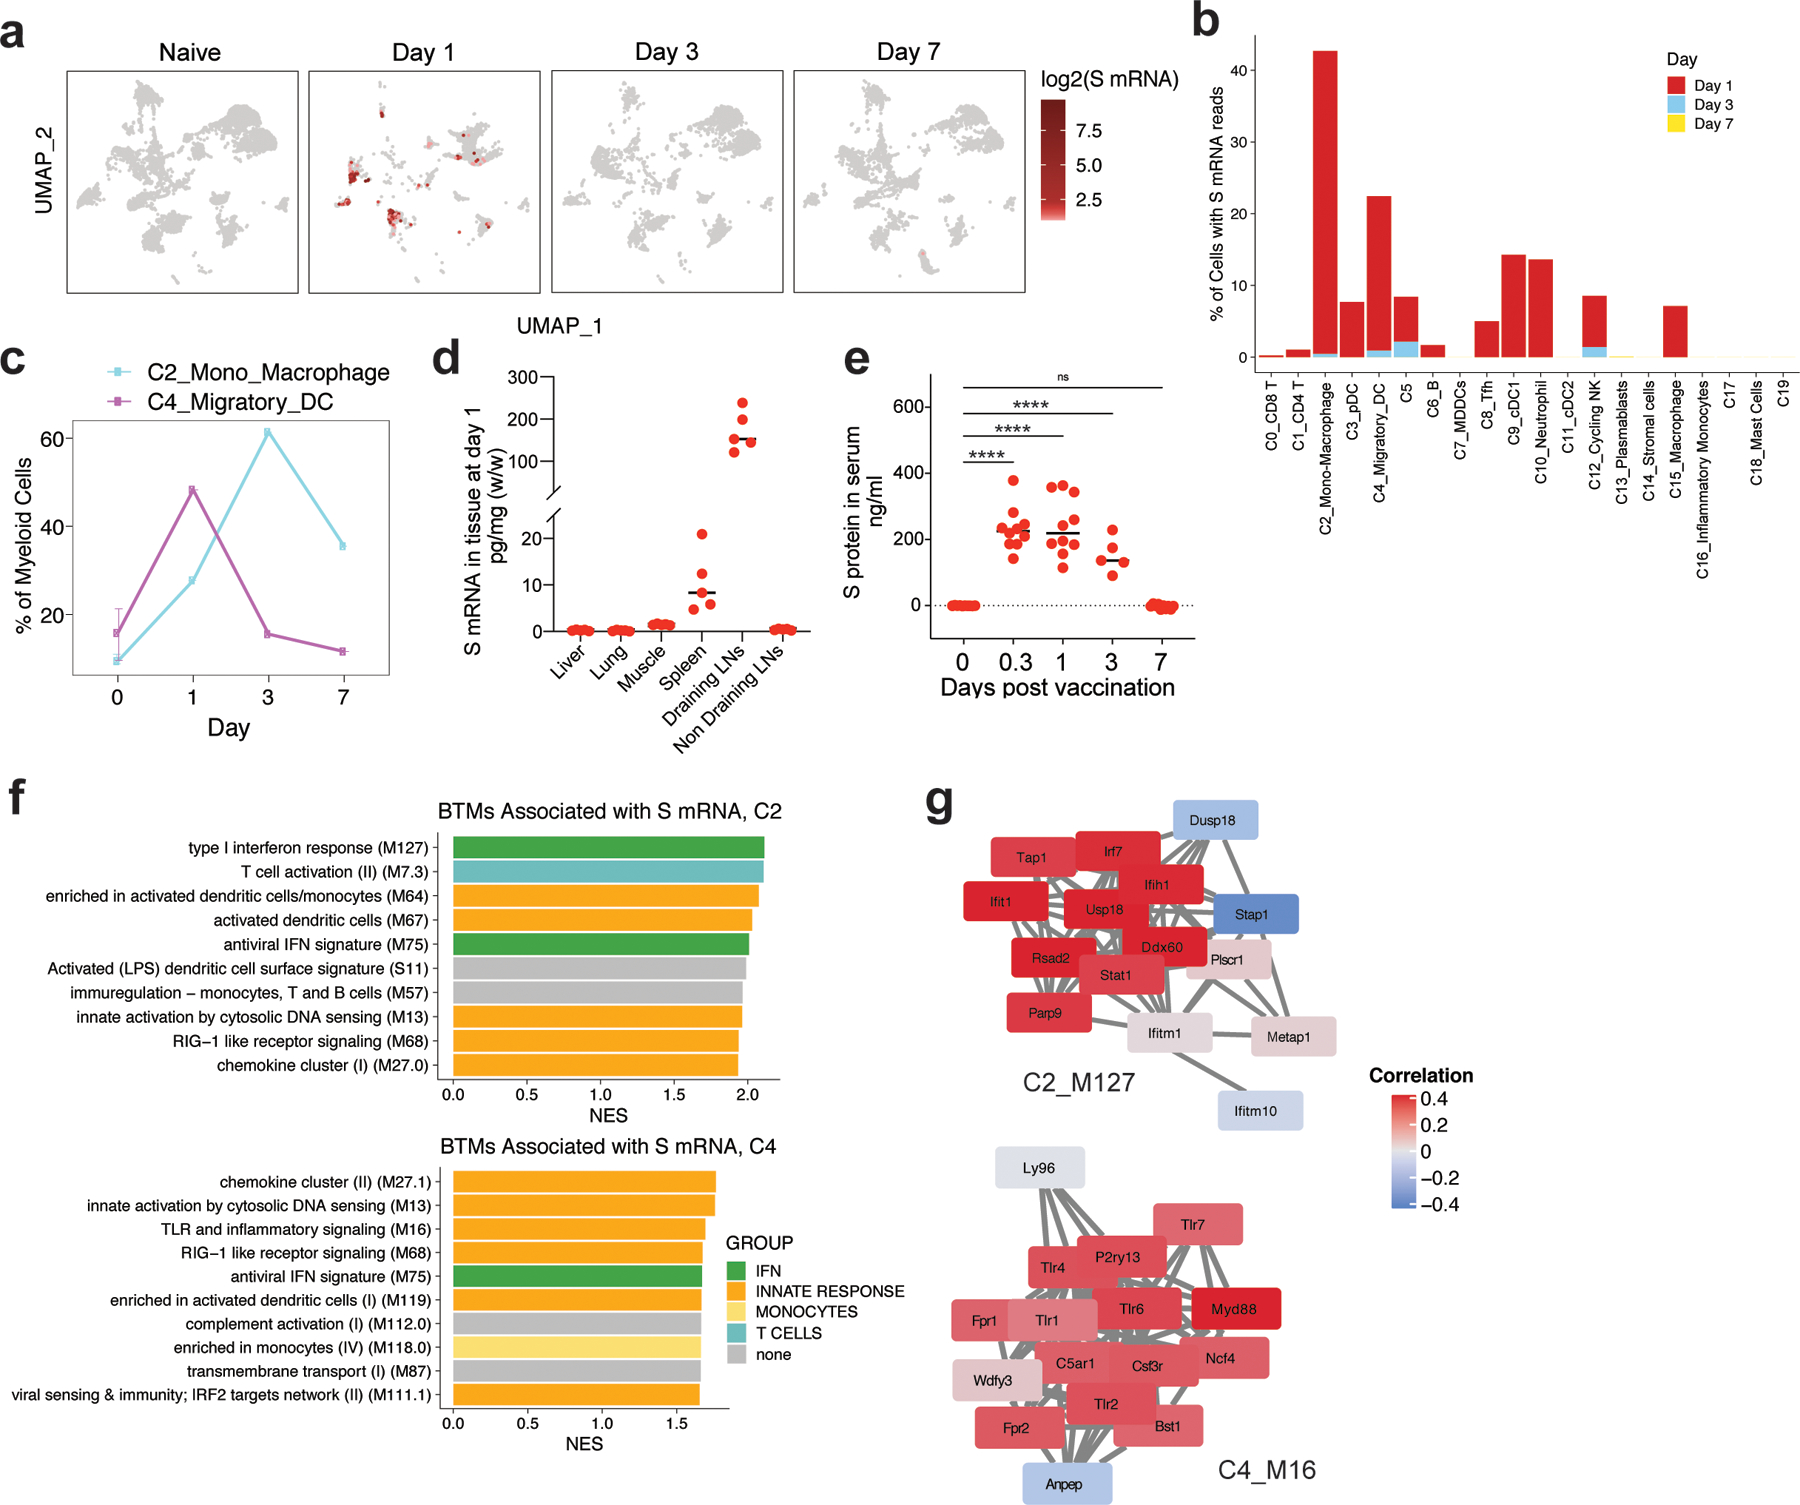
A, Distribution of S mRNA at the single-cell level (read >1/cell) from days 1 to 7 after BNT162b2 immunization. Cell clusters of UMAP are as shown in Fig. 4b. b, Percentage of cells with S mRNA reads in each cluster over time. c, Percentage of C2 and C4 in myeloid cells over time. d, Distribution of S mRNA in tissues at day 1 after BNT162b2 immunization measured by TaqMan based RT-PCR. n=5 for each tissue. e, S protein in mouse serum detected by ELISA. n=10 f, The BTMs associated with S mRNA signal in C2_Mono_Macrophage and C4_Migratory DC. g, The correlation between S mRNA signal and gene expression in BTM module M127 (Type I interferon response) in C2_Mono_Macrophage, and M16 (TLR and inflammatory signaling) in C4_Migratory DC, respectively. Samples used for scRNAseq were pooled from three independent experiments containing 8–10 mice. Data were one representative of two independent experiments (d) or combined from two independent experiments (e). One-Way ANOVA followed by Tukey’s test was applied in (e). ****P<0.0001.