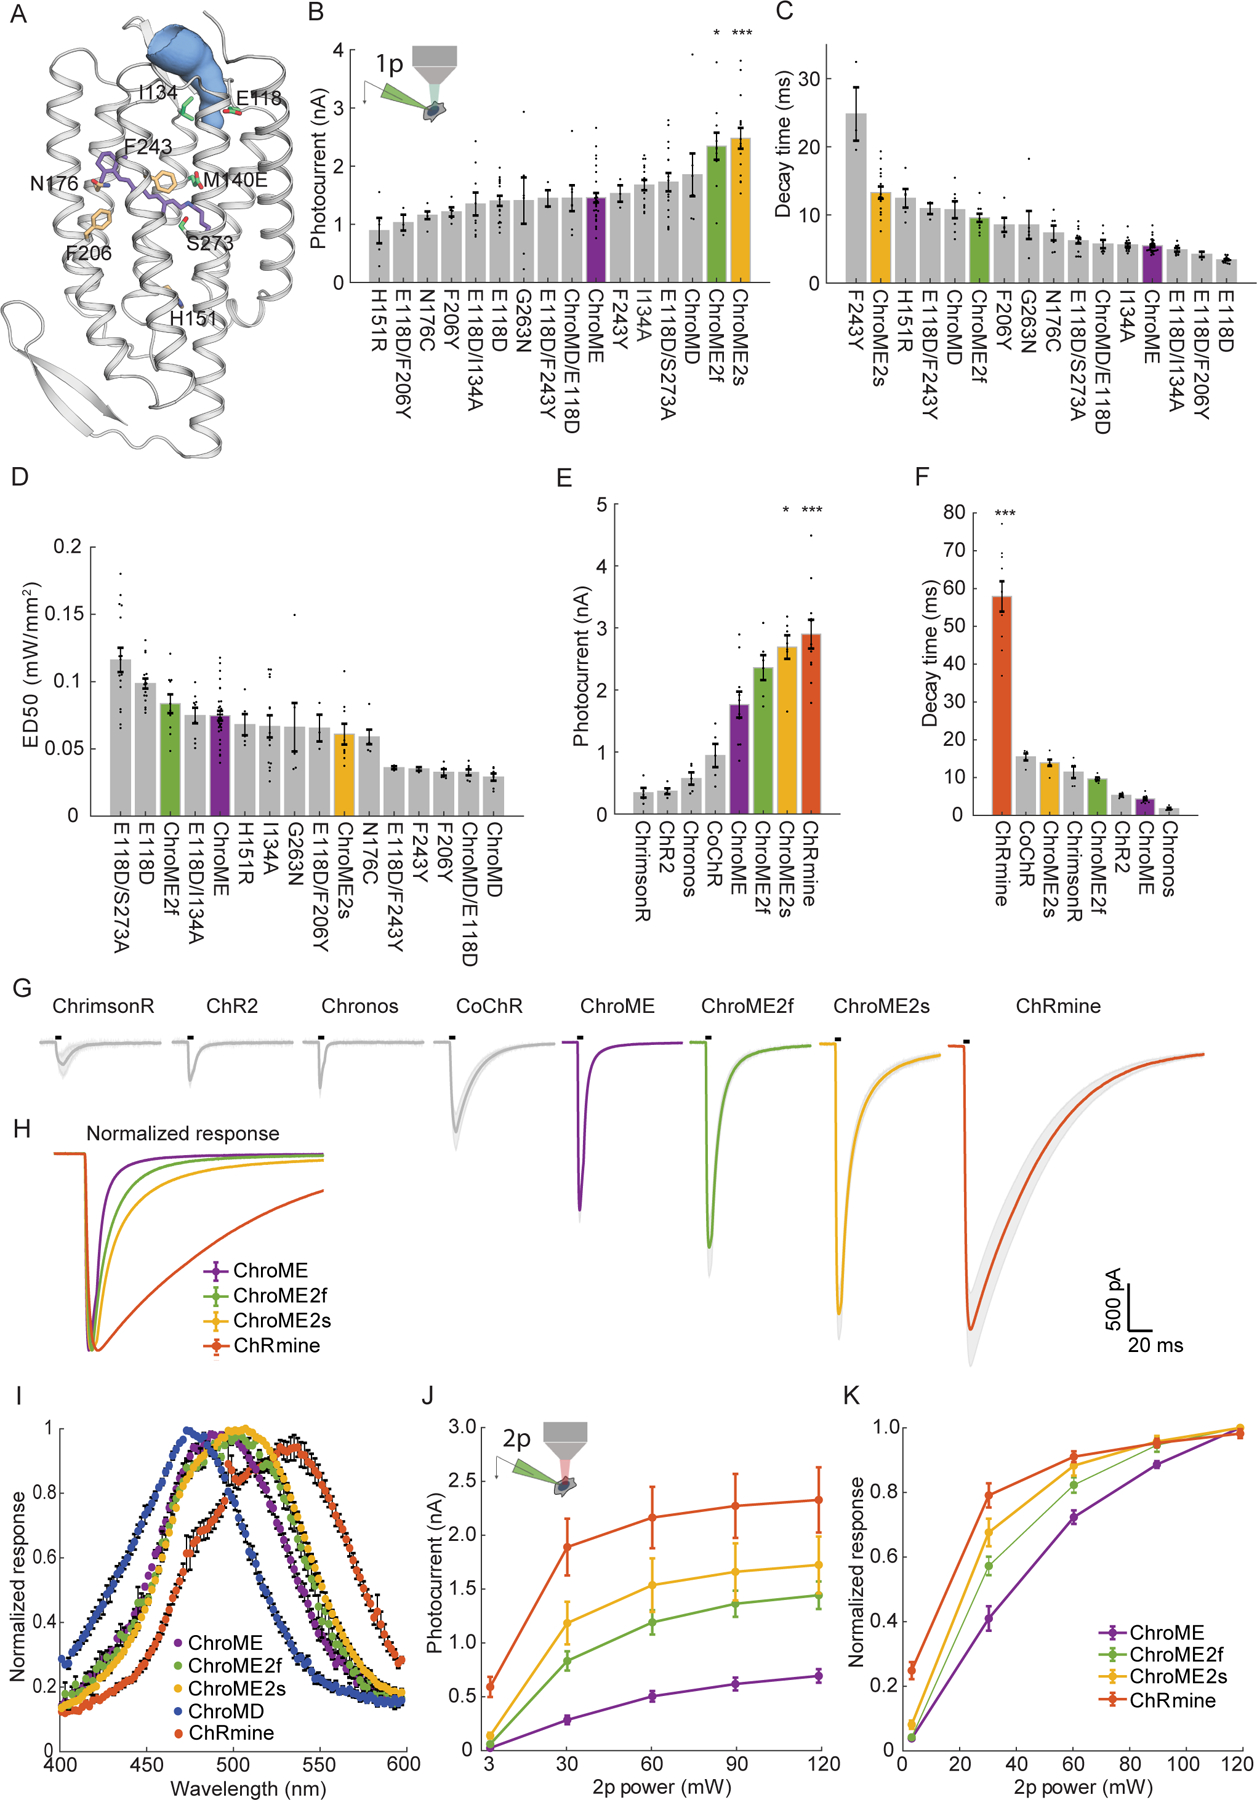
Figure 1. Design and characterization of second generation ChroME variants under visible and two-photon excitation.

A) Model of ChroME showing some of the amino acids that were targeted for mutagenesis. The retinal chromophore is shown in purple and the putative ion channel pore is indicated in blue.
B) Inset: schematic of a transfected cultured Chinese hamster ovary (CHO) cell under whole cell patch clamp. Peak photocurrents recorded under for each opsin mutant at (power = 0.45 mW at 510 nm unless otherwise indicated). For ChroMD, ChR2 and CoChR, 470 nm was used and for ChrimsonR, 630nm was used).
C) Decay time from monoexponential fits and D) Sensitivity (ED50) of opsin mutants from B)
E) Peak photocurrents of ChroME2f and ChroME2f compared against a panel or previously characterized opsins.
F) Estimated decay times from monoexponential fits for the same panel of opsins as in E).
G) Average photocurrent traces for indicated opsins obtained from data shown in E). The black bar above the trace indicates a 5 ms pulse of light.
H) Peak-normalized traces of the indicated opsins obtained from data shown in E.
I) Visible wavelength spectra of the indicated opsins at the specified wavelengths.
J) Photocurrents at the indicated powers under two-photon illumination at 1040 nm for the indicated opsins.
K) Normalized two-photon photocurrent response for the photocurrents show in J). P < 0.001, Two-way ANOVA, all opsins significantly different.
Data represent the mean ± s.e.m. Statistics: *P < 0.05, and ***P < 0.001 with ChroME as reference; One-way ANOVA with multiple comparisons test.
