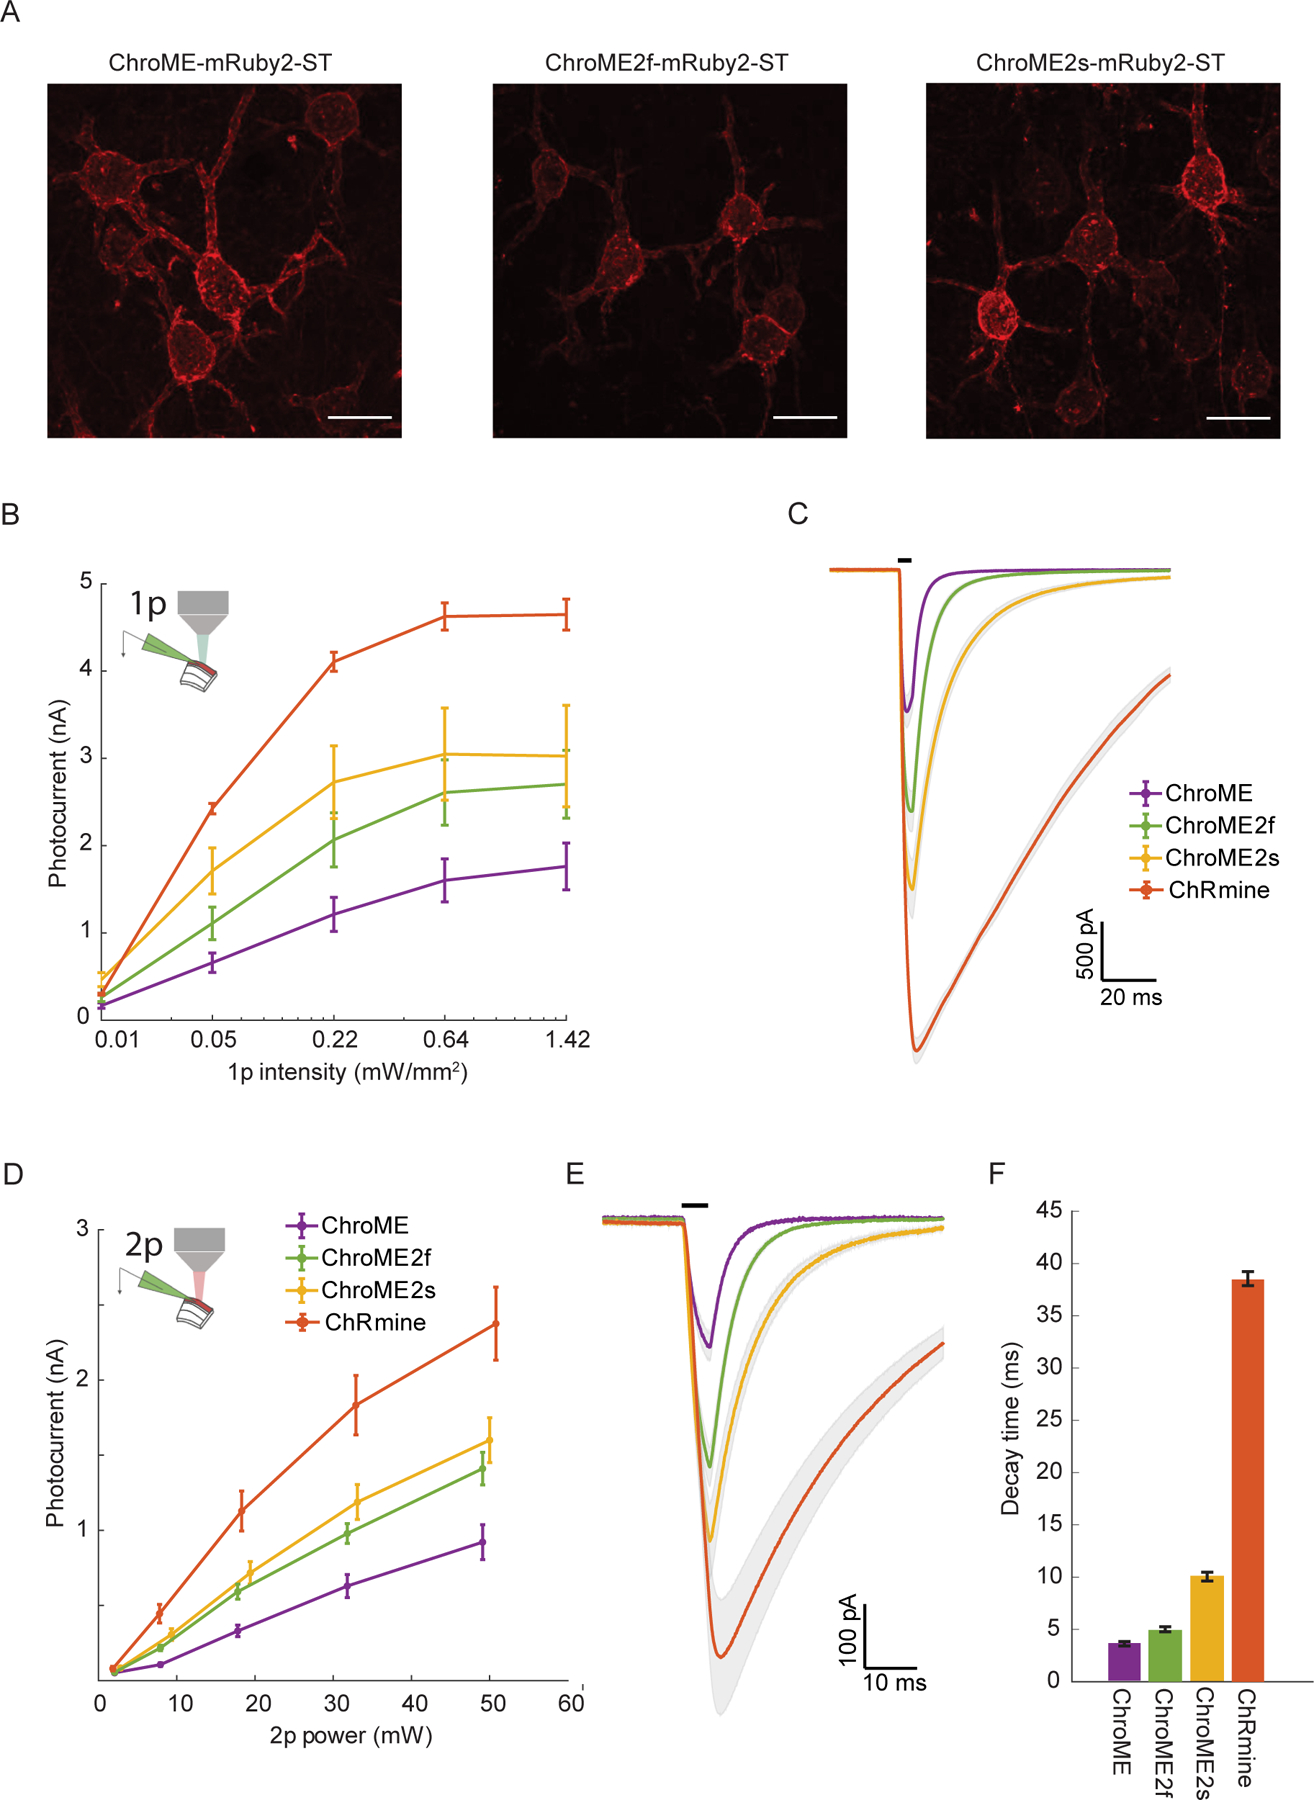
Figure 2. Validation of ChroME variants in acute brain slices under visible and two-photon excitation.

A) Max projections of confocal images of in utero electroporated L2/3 pyramidal neurons expressing ChroME, ChroME2f or ChroME2s, soma-targeted (ST) and fused to mRuby2 (opsin-mRuby2-ST). Scale bar represents 20 μm.
B) Photocurrents under full-field 1p illumination at 510 nm and the indicated powers from L2/3 pyramidal neurons expressing the indicated opsins via in utero electroporation. ChroME: n = 11 cells, 3 mice; ChroME2f: n =17 cells, 2 mice; ChroME2s: n = 12 cells, 2 mice; ChRmine: n = 6 cells, 1 mouse. P<0.005, Two-way ANOVA, all groups significantly different.
C) Average photocurrent traces for indicated opsins obtained from data shown in B). The black bar above the traces indicates a 5 ms pulse of light.
D) As in B) but with two-photon excitation and a ~12.5 μm diameter spot. P<0.005, Two-way ANOVA, all groups significantly different. ChroME: n=8 cells, 1 mouse; ChroME2f: n =14 cells, 2 mice; ChroME2s: n = 10 cells, n = 1 mouse; ChRmine: n = 10 cells, 2 mice.
E) Average photocurrent traces for indicated opsins obtained from data shown in D). The black bar above the traces indicates a 5 ms pulse of light.
F) Decay times of the three opsins measured with monoexponential fits (P<0.05, One-way ANOVA, all groups significantly different except ChroME and ChroME2f with multiple comparisons correction).
Data represent the mean ± s.e.m.
