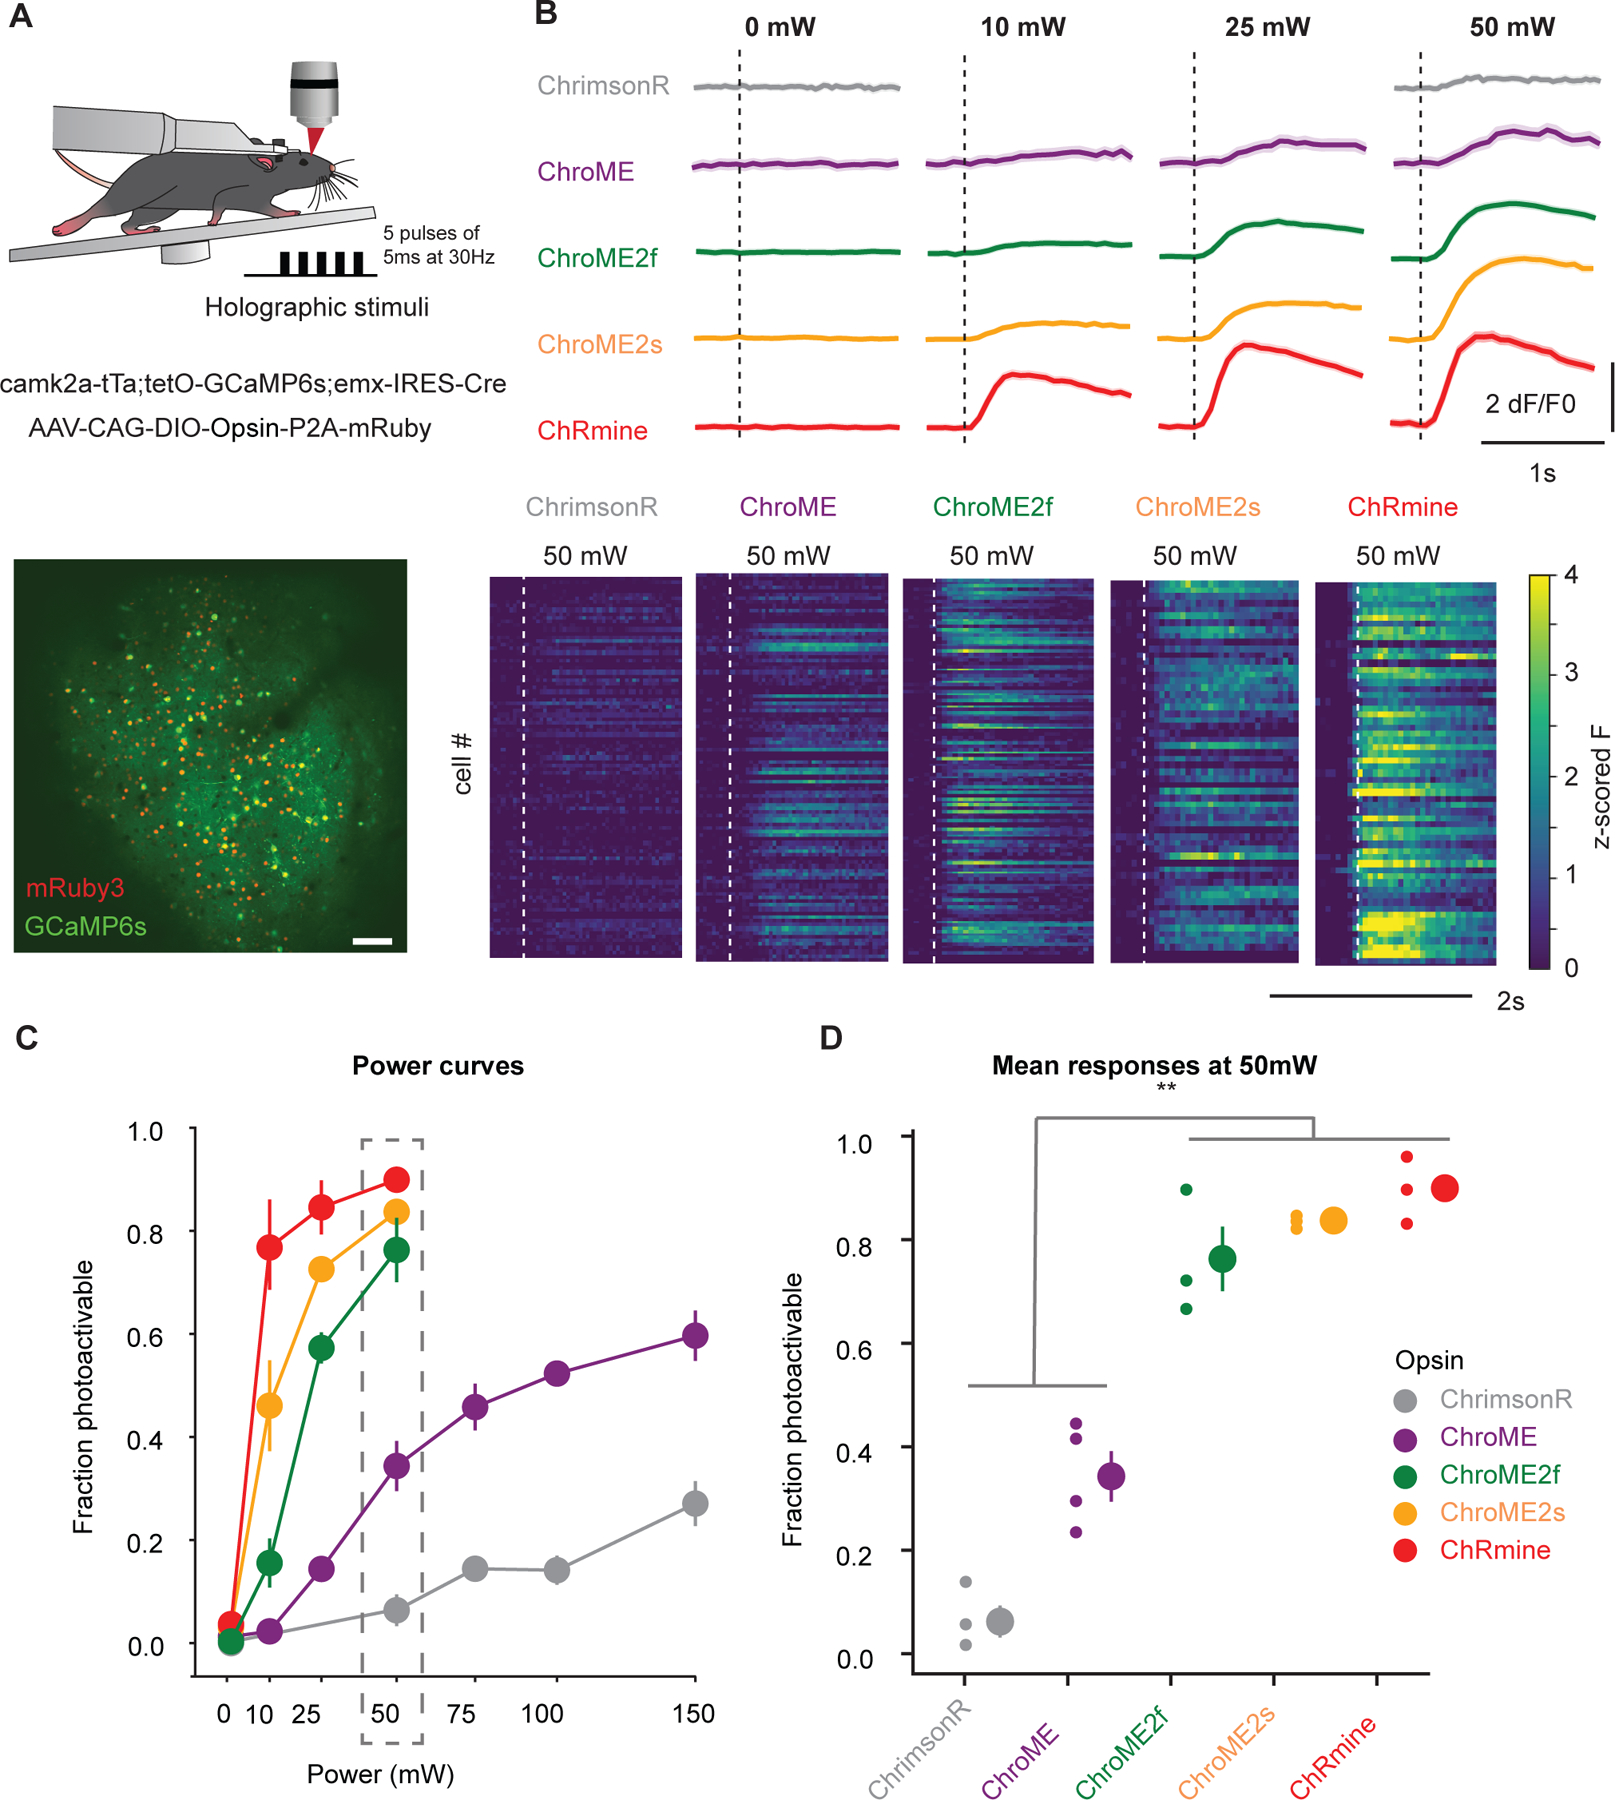
Figure 7. In vivo all-optical comparison of opsin potency for photo-stimulation.

A) Top: Experimental schematic. Adult transgenic mice virally expressing each of the five opsins in excitatory cells were holographically stimulated using 3D-SHOT (Mardinly et al., 2018). Individual cells were excited with a train of 5 pulses of 5ms duration at 30Hz at 1030 nm. Calcium imaging is performed at 920 nm. Bottom: In vivo two-photon image taken at 1020 nm of a representative FOV with all excitatory neurons expressing GCaMP6s (green). Opsin-expressing neurons are labeled with nuclear mRuby3 (red), which is used to automatically detect target cells. Scale bar: 100mm.
B) Top: Example traces (recorded at 920 nm imaging wavelength) of mean population responses of cells expressing each of the opsins to different power intensities. Bottom: Representative mean z-scored fluorescence peristimulus time histograms (PSTHs) for opsin-expressing cells stimulated at 50mW. Dashed lines indicate the onset of photostimulation.
C) Fraction of photoactivable cells as a function of power for each opsin (***p<0.001 for opsin effect, Two-way ANOVA). Post-hoc Tukey’s multiple comparison test was applied to ChroME2f, ChroME2s and ChRmine across all powers: ChroME2f < ChroME2s < ChRmine, *p<0.05 for all comparisons, n>=3 mice with >= 40 cells each per opsin. Error bars indicate s.e.m. Total number of mice were: 3, 4, 3, 3, 3, for ChrimsonR, ChroME, ChroME2f, ChroME2s and ChRmine, respectively.
D) Mean (± s.e.m.) fraction of successfully photoactivated cells (relative to all automatically segmented cells targeted in a FOV) for each opsin at 50mW. New generation opsins (ChroME2f, ChroMe2s and ChRmine) were significantly more potent than the previously generated ones (***p<0.001, One-way ANOVA, post-hoc multiple t-test with holm correction: Chrimson < ChroME < ChroME2f ≃ ChroME2s ≃ ChRmine, n ≥ 3 mice per opsin, with ≥40 cells per mice). Total number of mice were: 3, 4, 3, 3, 3, for ChrimsonR, ChroME, ChroME2f, ChroME2s and ChRmine, respectively.
