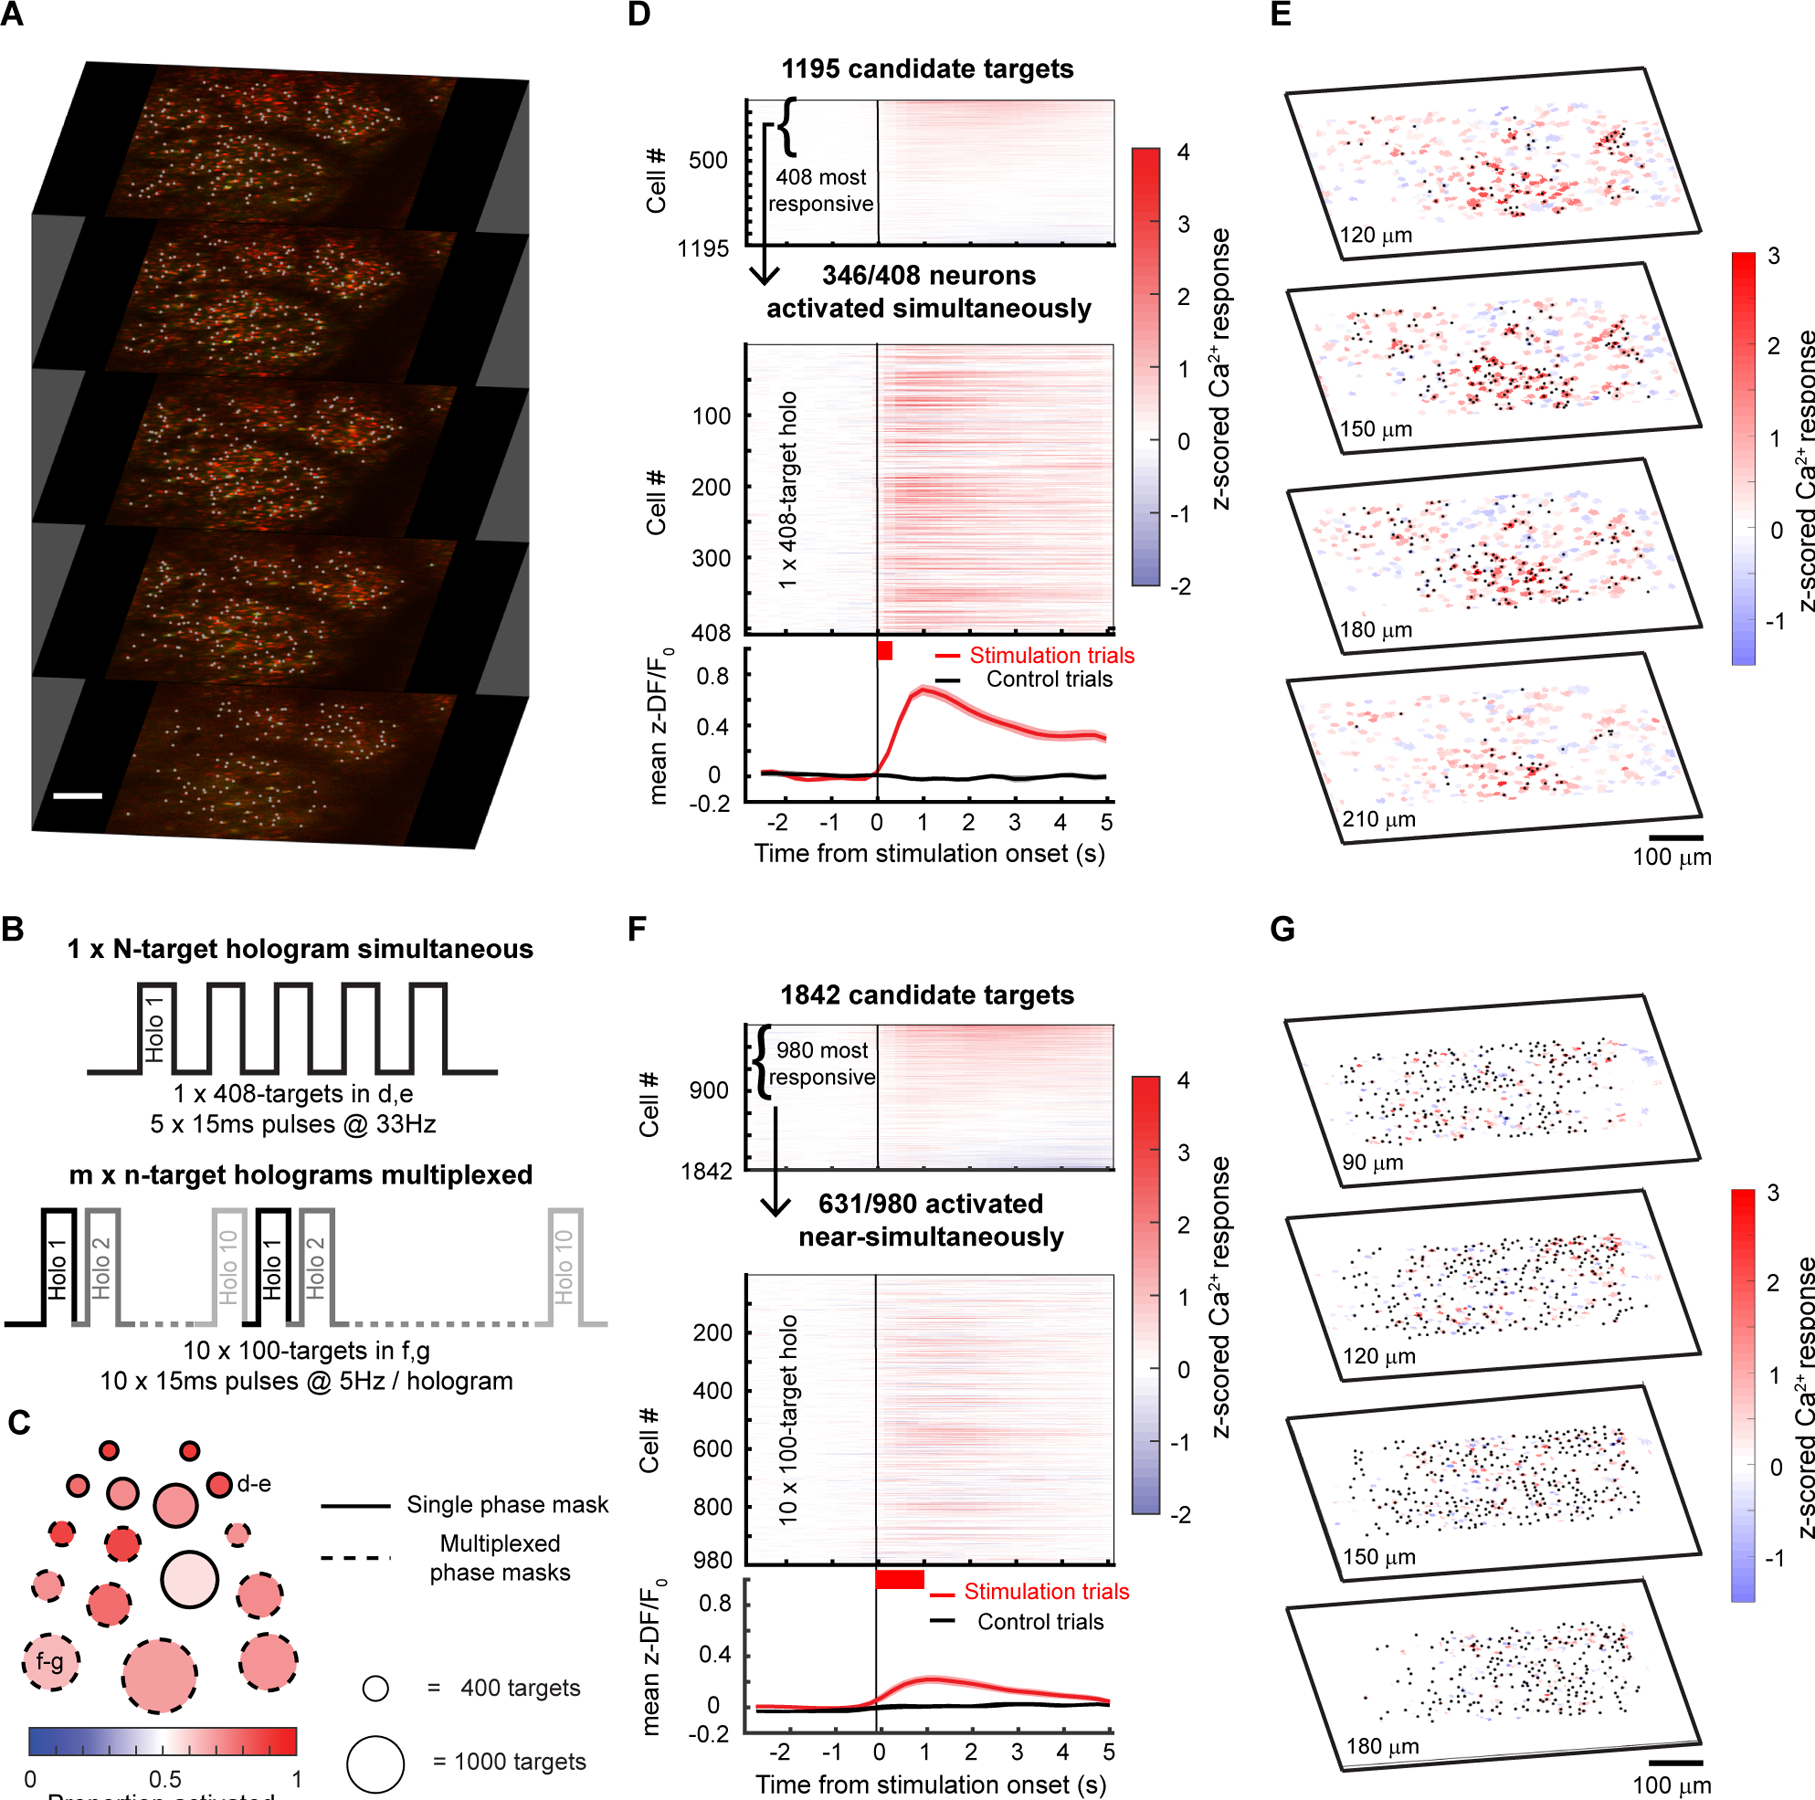
Figure 8. Large ensemble photo-stimulation in vivo with ChroME2s.

A) Example 5-plane volume stack used for large ensemble photo-stimulation experiments in mice viral expressing soma-targeted-ChroME2s-p2A-H2B-mRuby3. Imaging wavelength: 920 nm, photo-stimulation wavelength: 1040 nm. Initial targets for stimulation were identified based on nuclear mRuby3 expression (gray dots overlaid on red nuclei) and screened in small groups of 20–30 neurons for activation thresholds using 2-photon calcium imaging.
B) Schematic of large ensemble stimulation protocols. Top: A single holographic ensemble comprised of the most activatable neurons in the volume was stimulated at a predetermined frequency (5 × 15 ms pulses at 33 Hz for the 408-target ensemble in D-E). Bottom: The most activatable neurons in the volume were randomly divided into m × n-target ensembles and stimulated in a multiplexed manner by fast switching of SLM frames (5 × 15 ms pulses at 22 Hz for the 10 × 100-target ensembles in F-G).
C) Summary of the size and photoactivation of the targeted ensemble in each experiment using single phase masks (solid edged circles) and multiplexed phase masks (dashed edged circles). The diameter of the circle indicates the size of the ensemble, ranging from 308 targets for the single phase mask experiments to 1300 targets for the multiplexed experiments. The fill color indicates the proportion of targeted neurons successfully activated in each experiment. The example experiments shown in the remaining panels are denoted with the corresponding panel letters. Large ensemble experiments were performed on 6 mice/16 sessions (single phase mask: n=5 mice/7 sessions, multiplexed phase masks: n=5 mice/9 sessions).
D) Top: Raster plot of the response of 1195 candidate neurons across 4 planes to stimulation in the power screening step. In this example, the top 408 highly activated neurons at 20mW (Wilcoxon rank-sum test between z-scored ΔF/F before and after stimulation, p < 0.05) were picked for subsequent large ensemble stimulation. Middle: Raster plot of calcium responses to the 408-target ensemble stimulation at 20mW. The thick red bar below the x-axis indicates the total duration of photostimulation. 346/408 neurons in the ensemble were significantly activated and 51/408 neurons were suppressed by the stimulation (Wilcoxon rank-sum test, p < 0.05). Bottom: mean ± s.e.m calcium response of all neurons in the targeted ensemble on stimulation trials (red trace) and control trials (black trace).
E) 4-plane volumetric maps of the mean calcium responses of all recorded neurons for the 408-target ensemble experiment in D.
F) As in E) but for multiplexed stimulation of 10, 100-target ensembles. 631/980 neurons in the ensemble were significantly activated and 323/980 neurons were suppressed by the stimulation (Wilcoxon rank-sum test, p < 0.05). Bottom: mean ± s.e.m calcium response of all neurons in the targeted ensemble on stimulation trials (red trace) and control trials (black trace).
G) Similar to E but for the multiplexed ensemble stimulation shown in F.
