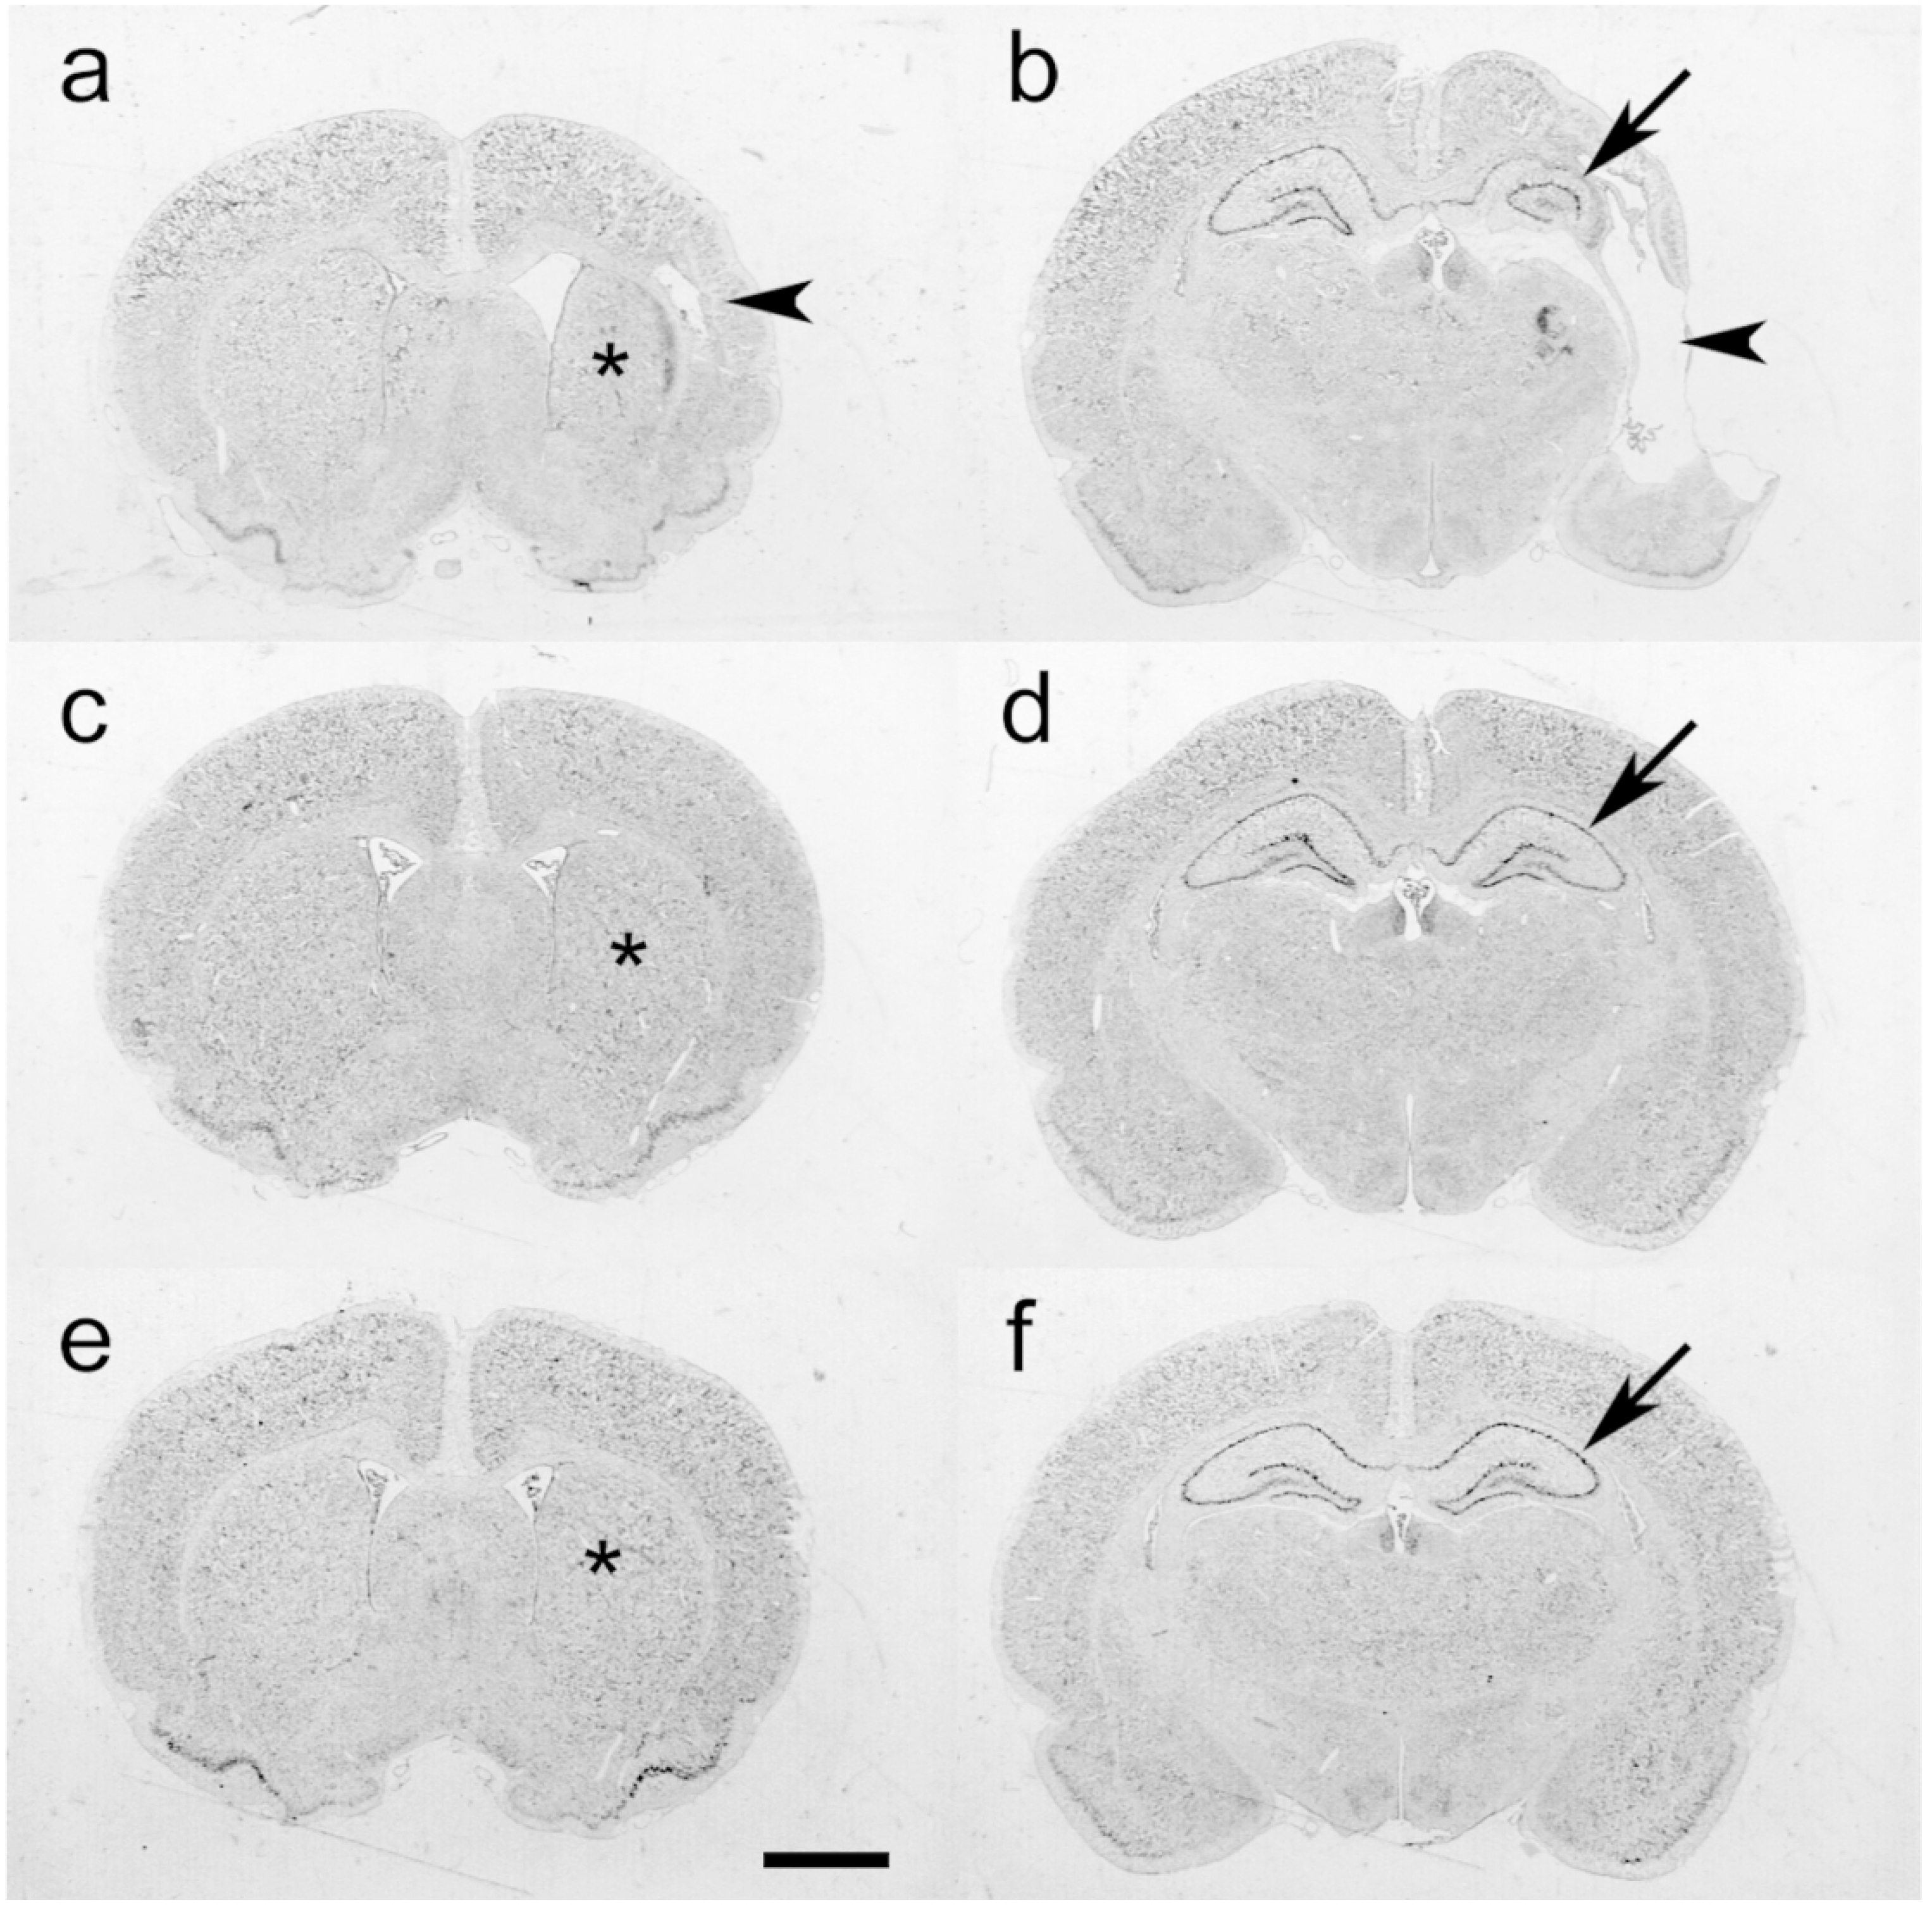
Figure 2. Azithromycin (AZ) Treatment Attenuates LPS-Amplified Hypoxic-Ischemic (HI) Neuropathology.

Panels a-f illustrate representative cresyl-violet stained coronal brain sections, obtained at P35, in samples from the 3 groups compared in Fig. 1. a–d. P7 rats received LPS injections followed by 50 min HI (LPS+HI; see Methods). Two h after the end of HI, animals started treatment with saline (a, b), the 3-dose AZ regimen (c, d; AZ*3), or the 5-dose AZ regimen (e, f; AZ*5). Sections a, c, and e are at the level of striatum (*); sections b, d and f are at the level of the dorsal hippocampus (arrows). In the LPS+HI control (a, b), note overall right hemisphere atrophy, striatal atrophy (*), marked hippocampal atrophy (arrow), and cortical thinning and cystic encephalomalacia (arrowheads). The AZ*3 sample (c, d) demonstrates mild right hemisphere and striatal atrophy (*), and minimal hippocampal atrophy (arrow). In a representative AZ*5 animal (e, f), only very mild right striatal (*) and hippocampal (arrow) tissue loss are evident. (Scale bar = 2 mm).
