Fig. 3.
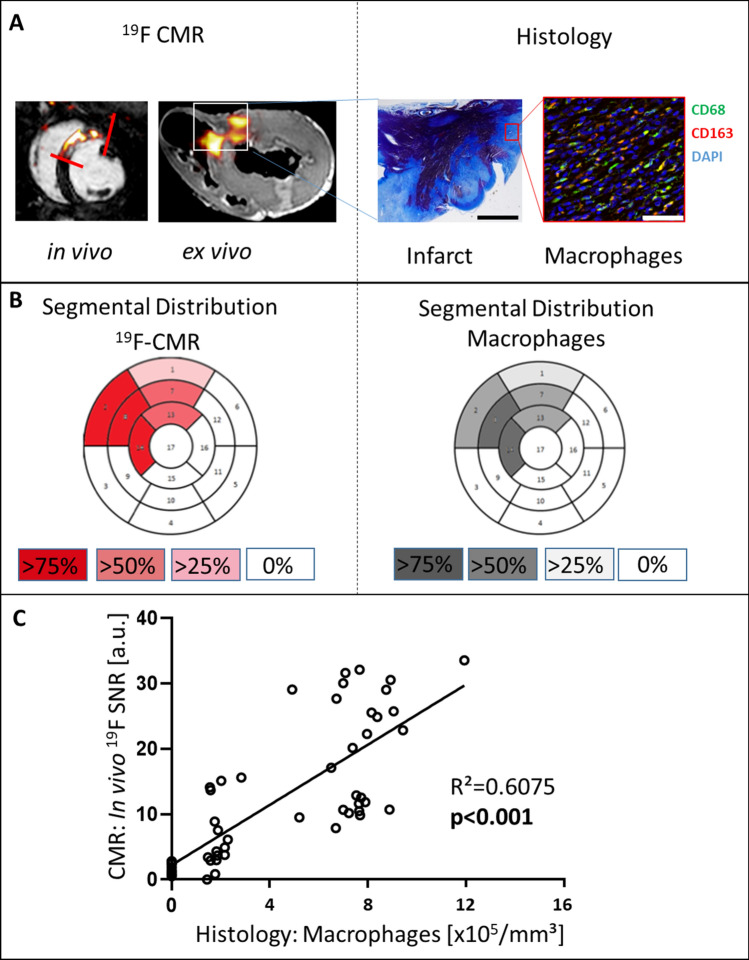
Correlation of in vivo 19F signals to macrophage density in histology. A Left: 19F-signals are heterogeneously distributed in the area of infarction as observed in vivo (red lines) and ex vivo (white box). Right: infarct histology with Masson’s trichrome strain: infarcted tissue = purple, granulation tissue = blue; fluorescent staining with anti-macrophage antibodies: CD68 (green, pseudocolored) and CD163 (red, pseudocolored) at × 40 magnification. Nuclear staining with DAPI (blue). Scale bar 7 mm at Masson`s trichrome strain and 50 µm at fluorescence staining. B Segmental analysis with red (19F) and black (macrophages) color intensity codes for the percentage of all individuals positive for the respective segment. C In vivo 19F SNR plotted against histological macrophage density expressed as cells/mm3. Shown are data points of all animals. At least 5 regions of interest distributed in at least 2 different slices were considered per animal. If animals had 19F signal in more than 5 regions in at least 2 different slices due to their large 19F volume, those data points were additionally taken into consideration

