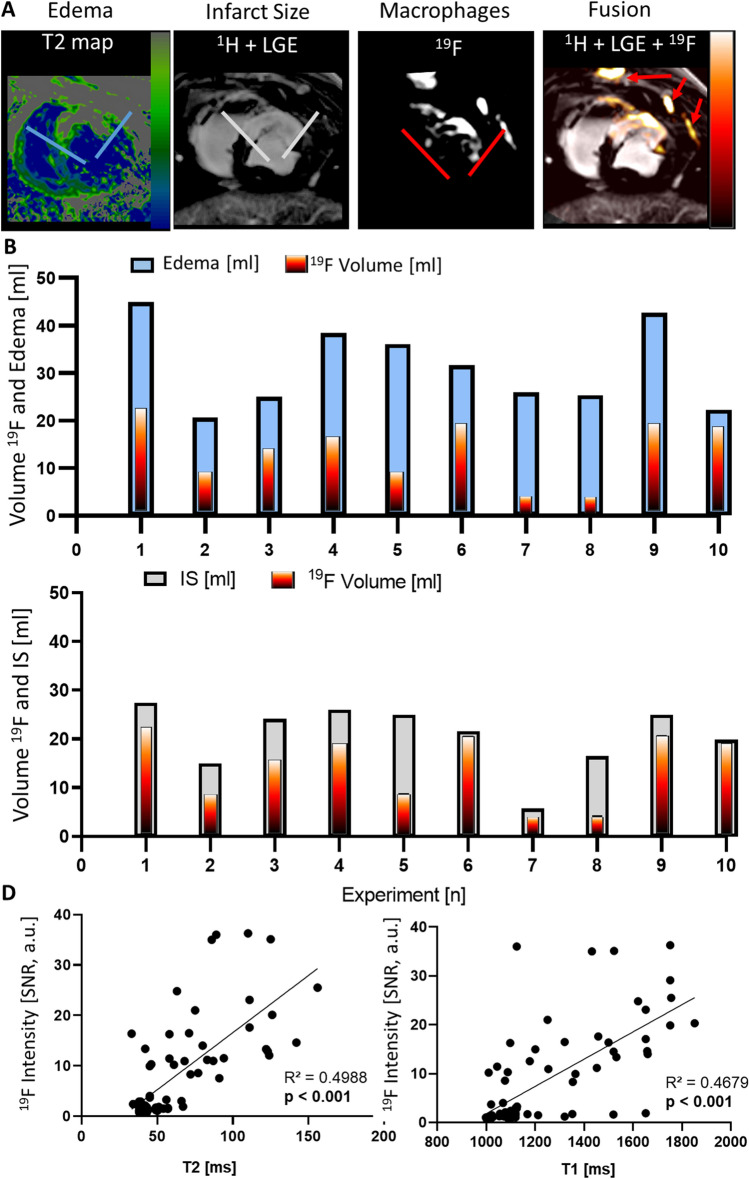
Fig. 4.
19F signals co-register with the infarct area. A 1H images with T2 mapping for identification of edema (blue lines) and late gadolinium enhancement (LGE) for infarct size (gray lines) were recorded (left) and fused with 19F images representing patchy macrophage presence (red lines). The 19F image overlay with the 1H image was performed automatically encoded with the “hot iron-lookup table” (HILT) in arbitrary units (right). Red arrows = signals in the sternum and ribs. Quantitative analysis of individual whole heart 19F volumes (HILT) and B edema extent (blue) as well as C infarct size (gray). D The 19F signal-to-noise ratio (SNR) of infarcted segments was significantly correlated with local T2 and T1 times.

