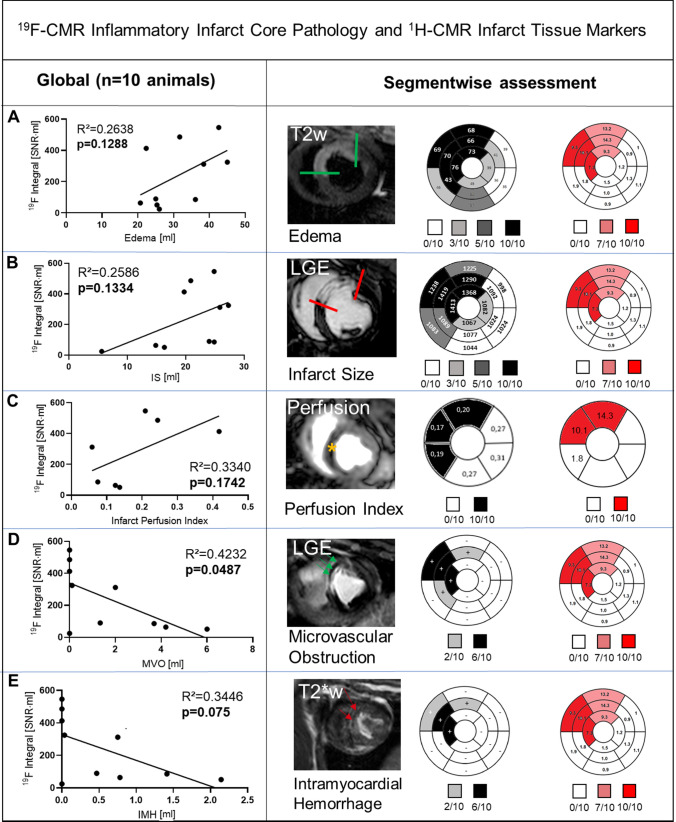
Fig. 5.
Segmental analysis of 19F integral and infarct tissue characteristics. Whole heart correlation of the 19F integral (Signal-to-noise-ratio [SNR] * ml) with infarct tissue characteristics (ml): A edema extent, B infarct size (IS), C regional perfusion, D microvascular obstruction (MVO) and E intramyocardial hemorrhage (IMH). The whole heart analysis, using a bivariate correlation model, revealed only MVO inversely correlated with 19F volume. Global and regional (segmental) analysis for the respective infarct pattern is given with example images (edema extent = green borders, IS = red borders, regional perfusion defect = yellow star, MVO = green arrows, IMH = red arrows). The bullseye plots are shown with color intensity coding according to the individuals positive for the respective segment. Additionally, 19F Signal to Noise Ratio, T1 and T2 values, as well as perfusion index, are given in mean values (n = 10 animals) per segment. IMH and MVO segments are indicated with “−”and “ + ”

