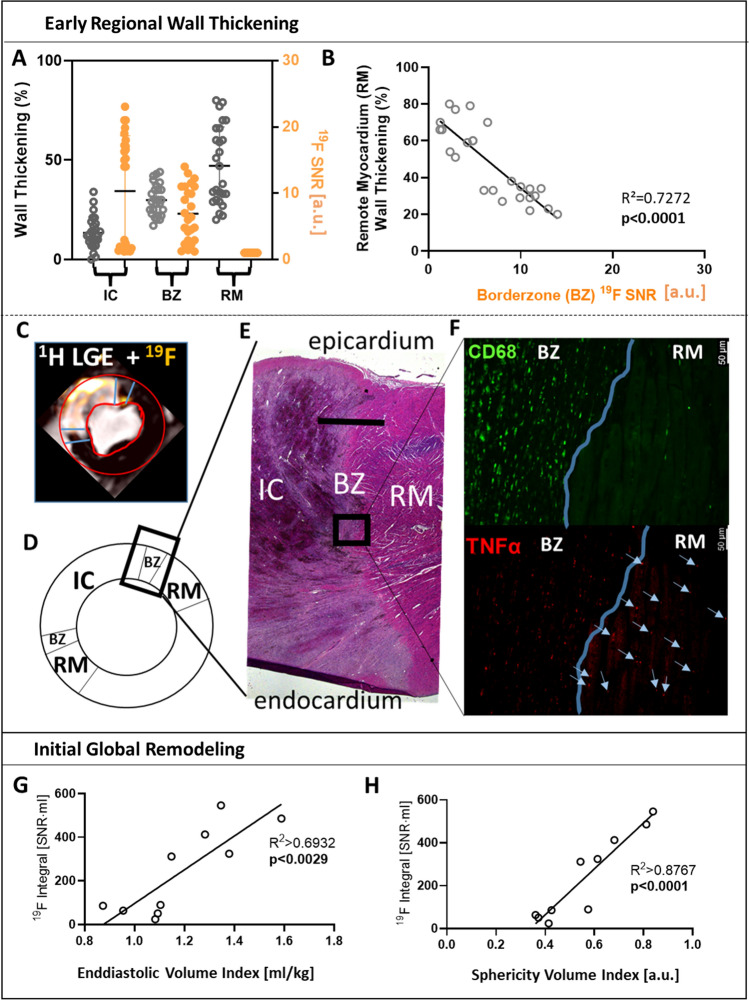
Fig. 6.
The border Zone 19F signal is associated with impaired remote systolic wall thickening and the whole heart 19F integral with initial remodeling post-AMI. A Myocardial systolic wall thickening (% of end diastolic thickness, gray) and 19F signal-to-noise ratio (SNR, orange) of the infarct core (IC), border zone (BZ) and remote myocardium (RM). B Correlation of RM systolic wall thickening to BZ 19F SNR. (C) 19F signal distribution across IC, BZ and RM as delineated by 1H magnetic resonance imaging with late gadolinium enhancement (LGE), D schematic assignment of left ventricular territories with region-of-interest pointing towards E representative histological (Hematoxylin Eosin Stain) overview of IC, BZ and RM. Scale bar 2.5 mm. F Histology of BZ/RM at identical region-of-interest with staining for macrophages (CD68, green) and TNF-α (red); Scale bar 50 µm. The blue line is highlighting the border of structurally intact cardiomyocytes as delineated by autofluorescence. Within BZ, there is a clear overlap of TNF-α + spots with CD68 + spots. In RM, blue arrows point towards TNF-α spots within cardiomyocytes as delineated by their autofluorescence. Correlation of whole heart 19F integral with end diastolic volume index (G) and sphericity volume index (H)

