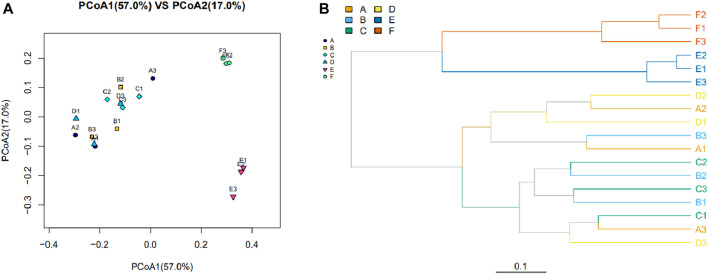
FIGURE 1.
The bacterial community and composition between samples were evaluated with a Beta diversity analysis. (A) Principal coordinate analysis based on weighted UniFrac. Each point represents a sample, with points of the same color derived from the same group. The closer the distance between the two points, the smaller the community composition difference. (B) Cluster analysis of bacterial community composition among different samples based on the weighted UniFrac. The length of the branches represents the distance between the samples; the closer the samples are on the branches, the more closely related the sample are to each other. The branches of the same color are from the same group.

