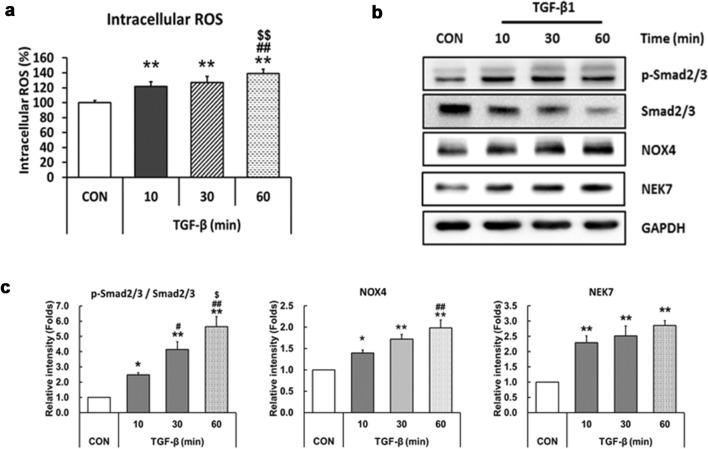
Fig. 2.
Treatment of TGF-β activates the NLRP3 inflammasome activation signals in LX-2 cells. a ROS formation was analyzed by H2-DCFDA assay. LX-2 cells were seeded in 96-well black plates and treated with 10 ng/ml TGF-β for 10, 30, or 60 min. After treatment with TGF-β1, the cells were treated with 10 uM H2-DCFDA for 20 min. Fluorescence was measured using a microplate reader. b LX-2 cells were treated as described in Fig. 2a, and protein levels of p-Smad2/3, smad2/3, NOX4, and NEK7 were analyzed by western blotting. GAPDH was used as an internal control. c Densitometric quantification results of western blot images are shown. Data are means ± SEM. **p < 0.01, *p < 0.05 vs. CON; ##p < 0.01, #p < 0.05 vs. TGF-β (10 min); $$p < 0.01, $p < 0.05 vs. TGF-β (30 min) (n = 3/group)

