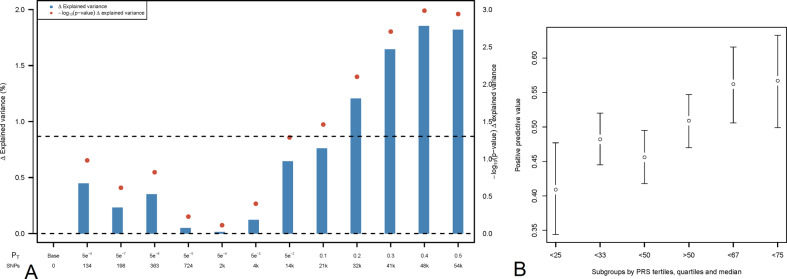
Fig. 2. Association between symptom severity while on clozapine and polygenic risk scores for schizophrenia.
A, B. Bar plot illustrating the explained variance for the association of schizophrenia-PRS with binary outcome at several pt, adjusted for sex, age, and 10 PCs. pt are displayed on the X-axis, where the number of included SNPs increases with more lenient pt. Δ Explained variance represents the Nagelkerke R2 (shown as %). The red dots represent the significance of the association results (-Log 10 p value). The dashed line represents a nominal significance-level of p < 0.05 (A). Individual risk prediction: higher schizophrenia-PRS was associated with higher positive predictive value for low symptom severity. Whiskers represent confidence intervals (±1.96 × standard error) around the central positive predictive value estimate (B).

