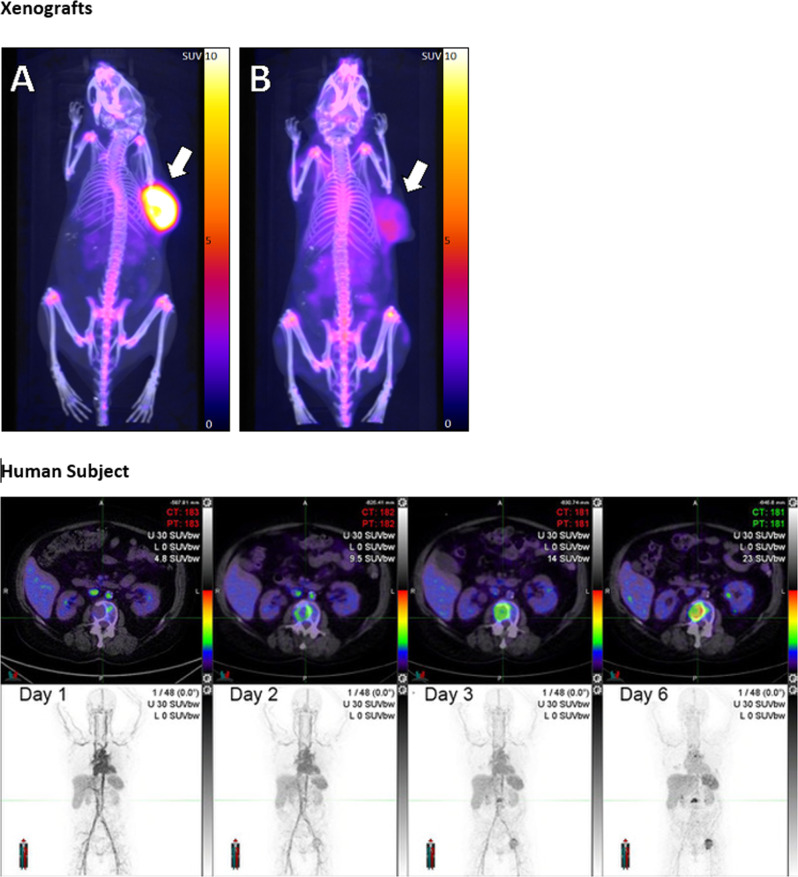
Fig. 3. Imaging PD-L1 in xenograft models and in a human subject using 89Zr-DFO-Sq-Durvalumab PET/CT.
The upper panels show 89Zr-DFO-Sq -Durvalumab PET/CT imaging of NSG mouse bearing either HCC-827 PD-L1 high tumour (Panel A) or a low-to-non PD-L1 expressing A549 tumour (Panel B) at 144 h after PET tracer injection. Pseudo-coloured SUV overlays on CT scan maximum projection images are shown. Subcutaneous human tumour xenografts on right flanks are indicated by arrows. The lower panels show the same 89Zr-durvalumab, as validated in the xenograft model, used for PET/CT imaging in a human subject with PD-L1 positive (90%) stage IV NSCLC. Over 6 days, sequential images show gradual accumulation of tracer in distant metastases. Axial PET/CT images (upper panels) show increasingly intensification of uptake in a vertebral body metastasis. Maximum intensity projection (MIP) images (lower panels) show blood pool imaging (day 1) and then gradual accumulation in metastatic disease, including lumbar spine and left hip. (Images courtesy of Dr Tim Akhurst, Peter MacCallum Cancer Centre).

