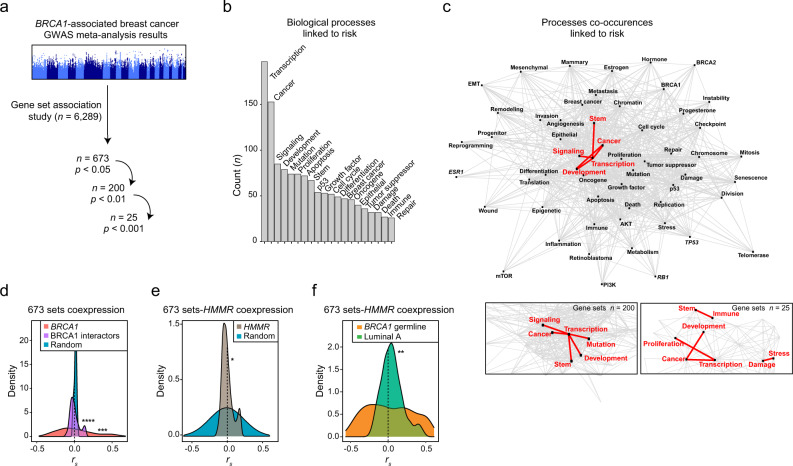
Fig. 1. Curated gene sets linked to BRCA1-associated breast cancer risk and expression correlation with candidate modifier HMMR.
a Gene set-based analysis of the summary statistics of the BRCA1-associated and triple-negative breast cancer GWASs. The number of gene sets analyzed and of those found to be significantly associated at three scoring thresholds are indicated. b Biological annotation of 673 risk-linked gene sets using text mining. The 20 most frequently identified keywords in the corresponding publication abstracts are shown (n, counts). c Top panel, network of the keywords mined across published studies of the 673 risk-linked gene sets. Centrality is proportional to the number of instances found, and edge length is inversely proportional to the number of times that two given keywords appear in a given abstract. Red edges and keywords depict the five most frequent keyword pairs. Bottom panels, zoom-in into the most frequent pairs considering the subsets of 200 and 25 risk-linked gene sets. d Distributions of the coexpression coefficients (Spearman’s correlation coefficient, rs) between the 673 sets and BRCA1, genes coding for BRCA1 interactors, or equivalent randomly chosen genes (x1000), across TCGA primary breast tumors. The asterisks indicate significant difference relative to random (Wilcoxon test; ***p = 0.001 and ****p < 0.0001). e Distribution of coexpression coefficients (rs) between the 673 risk-linked gene sets and HMMR, and equivalent null distribution across TCGA primary breast tumors. The asterisk indicates significant difference: two-tailed Student’s paired-samples t test; *p = 0.010; HMMR 95% confidence interval (CI) 0.007–0.055; 671 degrees of freedom. f Distributions of coexpression coefficients (rs) between HMMR and the 673 risk-linked gene sets across primary tumors with germline BRCA1 pathological variants (n = 18; indicated “BRCA1 germline”) or luminal A tumors (n = 234). The asterisks indicate significant difference (Wilcoxon test; **p = 0.002).

