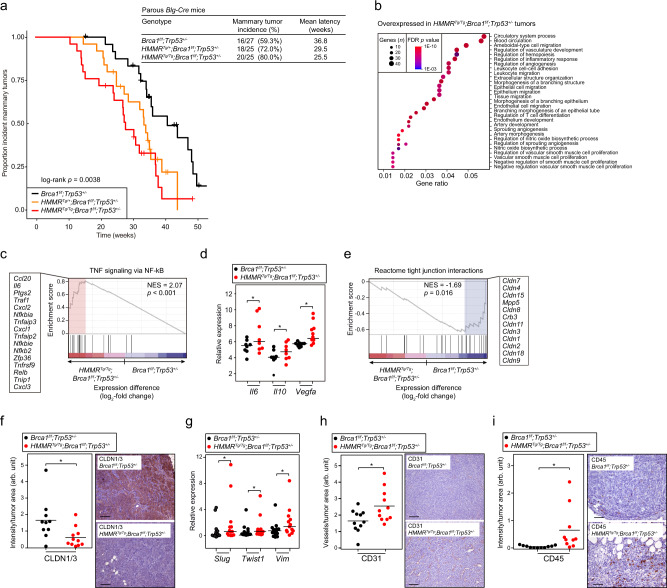
Fig. 3. HMMR overexpression increases Brca1-mutant mammary tumorigenesis, and modifies the cancer cell phenotype and tumor microenvironment.
a Left panel, Kaplan–Meier curves of mammary tumor incidence in mice divided into three genotype groups that differ by HMMR transgene status, as depicted in the inset. All mice were carriers of Blg-Cre, whose expression was induced by two rounds of pregnancy. Right top panel, table with details of the number of animals studied of each genotype, incidence of tumors, and mean latency. b Overrepresented (false discovery rate (FDR) < 1%; gene set size and FDR value color-coded) GO terms in genes overexpressed in HMMRTg/Tg;Brca1f/f;Trp53+/− relative to Brca1f/f;Trp53+/− tumors. c Gene Set Enrichment Analysis (GSEA) results showing overexpression of the “TNF signaling via NF-κB” gene set in HMMRTg/Tg;Brca1f/f;Trp53+/− tumors. GSEA was applied adopting standard parameters and using the pre-ranked expression differences (log2-fold change) between the two tumor sets; the normalized enrichment score (NES) and associated probability (Kolmogorov-Smirnov statistic and x1000 permutation test) are shown. The red rectangle indicates the overexpressed leading edge, and the corresponding gene names are depicted. d Overexpression of Il6, Il10, and Vegfa in HMMRTg/Tg;Brca1f/f;Trp53+/− tumors (inset, color-coded) corroborated by semi-qRT-PCR assays. One-tailed Student’s unpaired-samples t test; *p = 0.035 (Il6), 0.045 (Il10), and 0.013 (Vegfa). Horizontal lines depict the average tumor values (n = 2 experiments). e GSEA results showing underexpression (Kolmogorov-Smirnov statistic and x1000 permutation test) of genes coding for tight-junction proteins (Reactome pathway) in HMMRTg/Tg;Brca1f/f;Trp53+/− tumors. f Quantification of CLDN1/3 expression by immunohistochemistry assays and representative images of tumor staining in defined groups. Arbitrary units (arb. unit). One-tailed Student’s unpaired-samples t test; *p = 0.011. Scale bar = 100 μm. g Overexpression of Slug, Twist1, and Vim in HMMRTg/Tg;Brca1f/f;Trp53+/− tumors. One-tailed Student’s unpaired-samples t test; *p = 0.045 (Slug), 0.033 (Twist1), and 0.045 (Vim). Horizontal lines depict the average tumor values (n = 2 experiments). h, i Quantification (arb. units) of CD31 and CD45 by immunohistochemistry assays, and representative images of tumor staining in defined groups. One-tailed Student’s unpaired-samples t test; *p = 0.013 (CD31) and *p = 0.011 (CD45). Scale bar = 100 μm.

