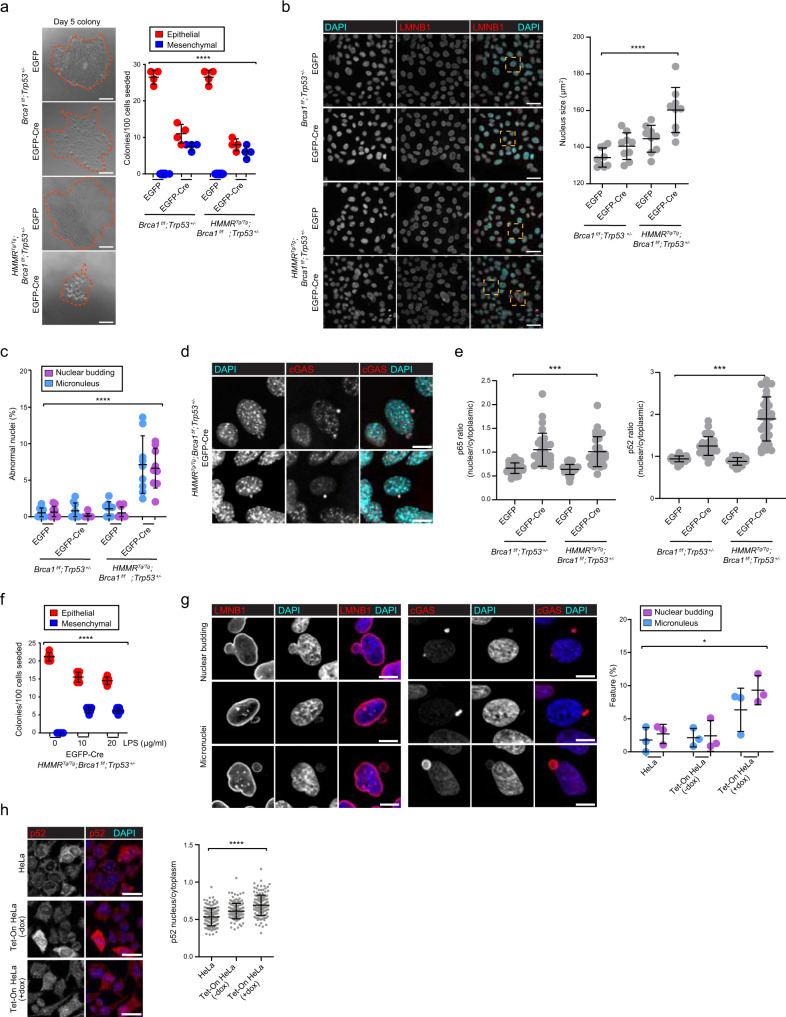
Fig. 4. BRCA1 loss and HMMR overexpression alters the epithelial cell phenotype and nuclear structure, prompting genomic instability and p52 nuclear expression.
a Left panel, bright-field images of day 5 CFC derived from Blg-Cre;Brca1f/f;Trp53+/− and Blg-Cre;HMMRTg/Tg;Brca1f/f;Trp53+/− MECs transduced with EGFP-empty or EGFP-Cre lentivirus. Scale bar = 100 μm. Right panel, colony output and colony phenotype in day 5 CFC (inset, color-coded; mean ± standard error of the mean (s.e.m.) from n = 4 wells; n = 2 experiments; n = 100 cells/well). One-way ANOVA; ****p < 0.0001. b Left panels, lamin B1 (LMNB1) detection and/or 4ʹ,6-diamidino-2-phenylindole (DAPI) showing nuclei and nuclear lamina architecture in subconfluent MEC cultures. Scale bar = 40 μm. Right panels, quantification of nucleus size (μm2; mean ± standard deviation (s.d.) from n = 9 frames; n = 3 experiments; >125 cells/experiment). One-way ANOVA; ****p < 0.0001. c Frequency of micronucleus and nuclear blebbing in day 5 colonies (mean ± s.e.m. from n = 6 wells; n = 3 experiments; >125 cells/experiment). One-way ANOVA; ****p < 0.0001. d cGAS-positive micronuclei in Blg-Cre;HMMRTg/Tg;Brca1f/f;Trp53+/− MECs transduced with EGFP-Cre lentivirus. Scale bar = 10 μm. e Ratio (nucleus/cytoplasm) of p65 and p52 intensity in day 5 colonies (mean ± s.d. from n = 30 cells; n = 2 experiments). One-way ANOVA; ***p = 0.001. f Colony phenotype of Blg-Cre;HMMRTg/Tg;Brca1f/f;Trp53+/− EGFP-empty MECs treated with LPS during colony formation (mean ± s.e.m. from n = 6 wells; n = 3 experiments; 100 cells seeded per well). One-way ANOVA; ***p = 0.001. g Nucleus budding and micronuclei (LMNB1, left panel), and micronuclei (cGAS, middle panel) detection in HeLa cells overexpressing HMMR. Scale bar = 10 μm. Right panel, percentage of cells displaying nucleus budding or micronuclei (mean ± s.d. from n = 3 experiments with 105-242-253 (HeLa); 151-183-208 (Tet-On -dox); and 147-155-176 (Tet-On +dox) cells). One-way ANOVA; *p = 0.014. h Left panels, p52 nuclear/cytoplasm localization in analyzed cell settings. Scale bar = 30 μm. Right panel, p52 nuclear/cytoplasm ratio (mean ± s.d. from n = 3 experiments consisting of 150 (HeLa), 150 (-dox), and 150 (+dox) cells). One-way ANOVA; ****p < 0.0001.

