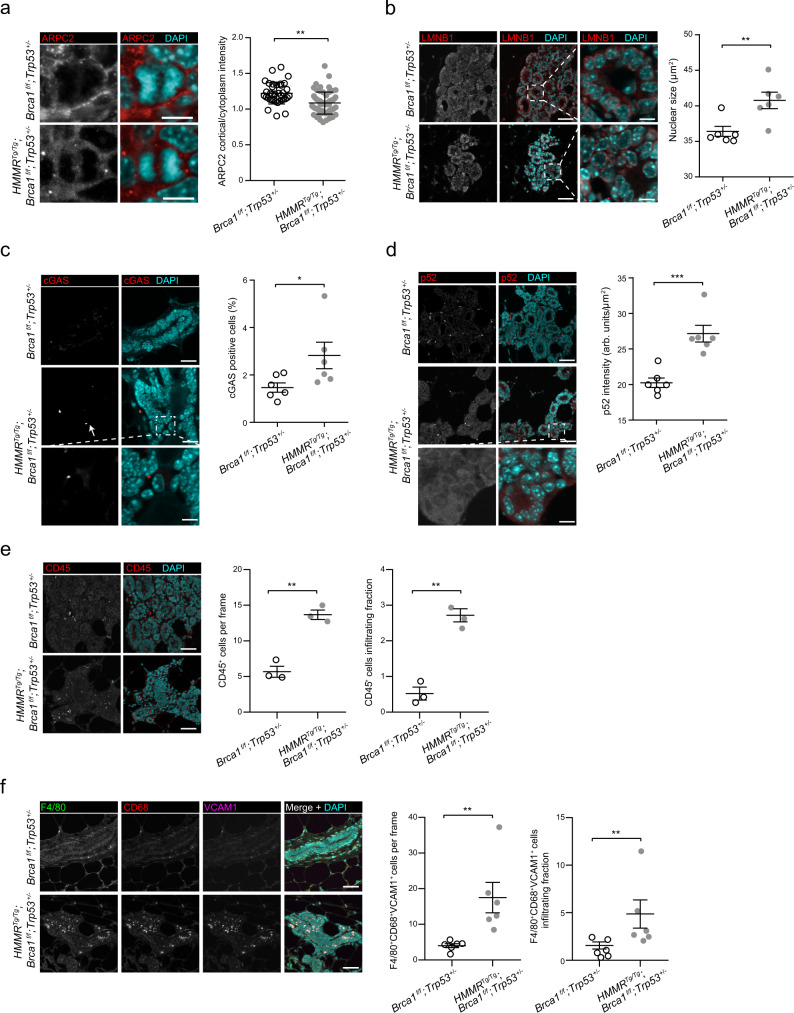
Fig. 6. Detection of HMMR-mediated perturbations in premalignant mouse mammary tissue.
a Cortical enrichment of ARPC2 in premalignant mammary epithelial cells. Mitotic cells (mean ± s.d.; n = 40 cells for HMMRTg/Tg;Brca1fl/fl;Trp53+/− + EGFP from six tissue; mean ± s.d.; n = 60 cells for HMMRTg/Tg;Brca1fl/fl;Trp53+/− + EGFP-Cre from four tissue) were analyzed in six mice per genotype. Scale bar = 10 μm. Two-tailed Student’s unpaired-samples t test; **p = 0.002. b Immunofluorescence analysis and quantitation of size of nuclei (μm2) in premalignant mammary epithelial cells from six mice per genotype, using LMNB1 staining (mean ± s.e.m.). Two-tailed Student’s unpaired-samples t test; **p = 0.009. Scale bar = 20 μm and 4 μm (zoom). c Immunofluorescence analysis and quantitation of cGAS positive staining in tissue from six mice per genotype (mean ± s.e.m.). Two-tailed Student’s unpaired-samples t test; *p = 0.046. Scale bar = 20 μm and 4 μm (zoom). d Immunofluorescence analysis and quantitation of p52 in premalignant mammary epithelial cells from six mice per genotype (arb. units/μm2; mean ± s.e.m.). Two-tailed Student’s unpaired-samples t test; ***p = 0.0005. Scale bar = 20 μm and 4 μm (zoom). e Immunofluorescence analysis and quantitation of CD45-positive (CD45+) cells in premalignant mammary tissue from three mice per genotype. CD45+ cells and those infiltrating the epithelial structures were measured per frame (mean ± s.e.m.; n = 3 frames per tissue; each frame >100 cells; n = 3 experiments). Two-tailed Student’s unpaired-samples t test; **p = 0.001 (per frame and infiltrating). Scale bar = 20 μm. f Immunofluorescence and quantitation of F4/80+CD68+VCAM1+ macrophages in premalignant mammary tissue from six mice per genotype (mean ± s.e.m.; n = 10 frames per tissue; each frame >100 cells; n = 2 experiments). Two-tailed Student’s unpaired-samples t test; **p = 0.002 (per frame) and **p = 0.009 (infiltrating). Scale bar = 20 μm.

