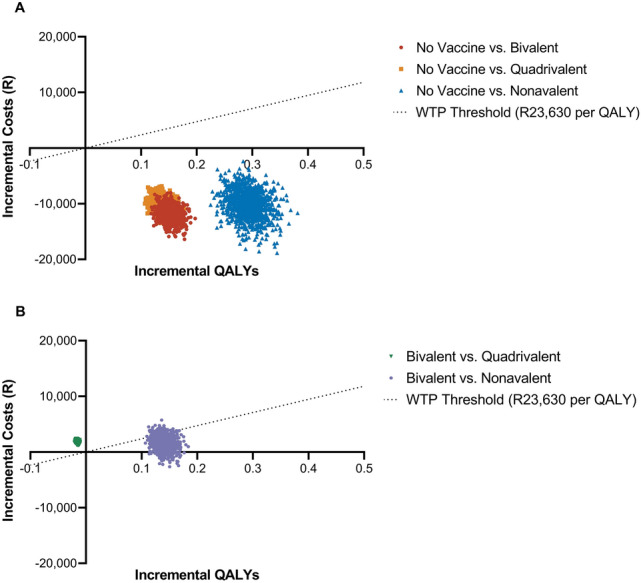
Fig. 2.

Probabilistic sensitivity analysis for HPV vaccination strategies displayed on a cost-effectiveness plane compared with a no vaccination and b bivalent vaccination. The graph maps incremental QALYs across incremental costs for 1000 iterations of the conducted probabilistic sensitivity analysis. Graph A compares no vaccination with a bivalent, quadrivalent, or nonavalent vaccination strategy, while graph B compares a bivalent strategy with a quadrivalent and nonavalent vaccination strategy. Costs are displayed in 2019 R. HPV human papillomavirus, QALYs quality-adjusted life-years, R South African Rand, WTP willingness to pay
