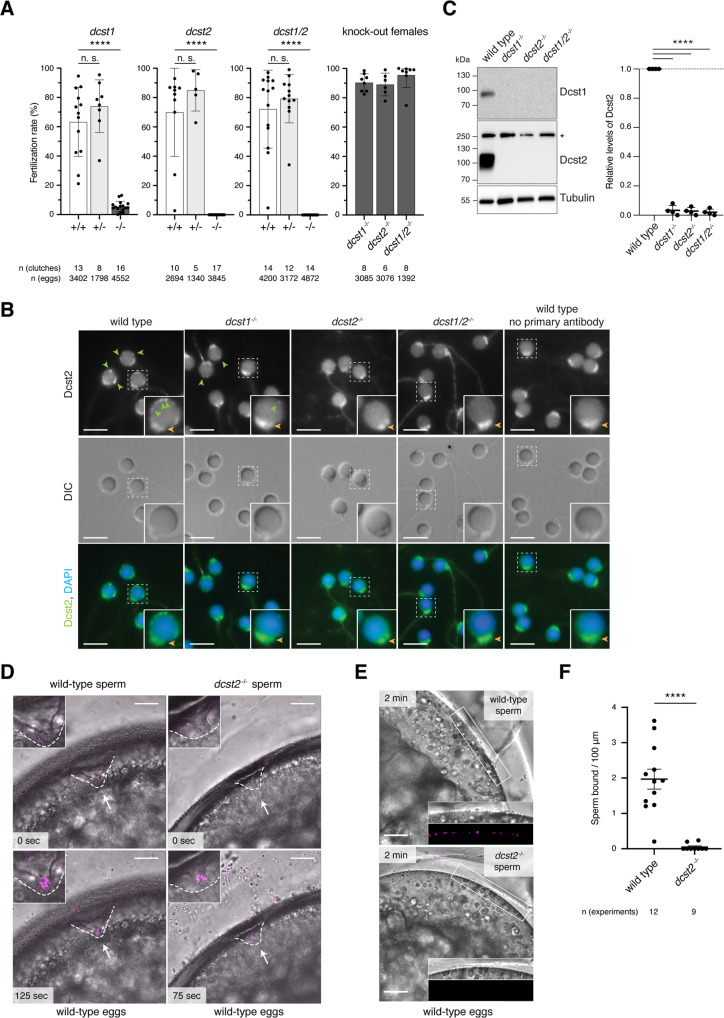
Fig. 5. Dcst1 and dcst2 are essential for male fertility in zebrafish.
A Dcst1 and dcst2 mutant zebrafish are male sterile. Quantification of fertilization rates as assessed by the number of embryos that progress beyond the one-cell stage. Left three panels: Males of different genotypes [wild-type sibling (+/+; white); heterozygote sibling (+/−; light gray); homozygote sibling (−/−; dark gray)] were crossed to wild-type females; right panel: homozygous mutant females (−/−; dark gray) of the indicated genotypes were crossed to wild-type males. The number of individual clutches and the total number of eggs per genotype are indicated. Data are means ± SD; adj. ****p < 0.0001 (Kruskal–Wallis test with Dunn’s multiple-comparisons test); n.s., not significant. B Dcst2 localizes to the periphery of the sperm head. Immunofluorescent and differential interference contrast (DIC) images of wild-type and mutant zebrafish sperm. Sperm were stained with DAPI (blue) to visualize nuclei and an antibody against the RING-finger domain of zebrafish Dcst2. Dcst2 localizes to distinct foci around the sperm head (green arrowheads). Dcst2 foci are reduced (dcst1−/−) or not detectable (dcst2−/−; dcst1/2−/−) in mutant sperm, while overall sperm morphology in DIC images appears normal for all genotypes. Autofluorescence of the sperm mid-piece appears as a uniform signal in the Dcst2 channel (orange arrowhead) in all genotypes. Scale bar: 5 μm. Boxed inset shows an individual enlarged sperm head for each genotype. C Dcst1 and Dcst2 are absent in mutant sperm. Exemplary immunoblot of sperm samples of wild-type and mutant genotypes probed with antibodies against zebrafish Dcst1 and Dcst2. Tubulin protein levels of the same blot are shown as loading control. For Dcst2, an unspecific band (asterisk) is detected in all genotypes at ~250 kDa. Quantification of Dcst2 levels of wild-type and mutant sperm based on n = 4 biologically independent immunoblots. Values were normalized to tubulin and then to wild-type levels. Data are means ± SD; ****p < 0.0001 (one-way ANOVA and multiple comparisons analysis). D Dcst2 mutant sperm are motile and reach the micropyle. Images from time-lapse movies of wild-type (left) or dcst2−/− (right) sperm added to wild-type eggs. Sperm (magenta) were labeled with MitoTracker and added to inactivated eggs. Sperm and eggs were activated by addition of water just before the start of the movie. The micropyle (white arrow), a preformed funnel in the egg coat through which the sperm reach the oolemma, is outlined with a dashed white line. Top images depict the first acquired image following sperm addition: no sperm has entered the micropylar area in either wild-type or mutant samples. Bottom images (125 and 75 s after sperm addition in wild-type and dcst2−/− samples, respectively): sperm can readily be detected within the micropylar area (inset). Scale bar: 75 μm. E, F Dcst2 mutant sperm are defective in stable binding to wild-type eggs. E Images from a time-lapse movie of wild-type (top) or dcst2−/− (bottom) sperm added to activated and dechorionated wild-type eggs. Sperm (magenta) were labeled with MitoTracker and activated at the time of addition to the eggs. Wild-type sperm show clear binding to the surface of the egg (inset), while dcst2−/− sperm are unable to stably bind to the oolemma. Scale bar: 50 μm. F Binding of sperm was assessed by quantifying the number of stably bound sperm in a 1-min time window. The number of independent experiments is indicated. ****p < 0.0001 (Mann–Whitney test).

