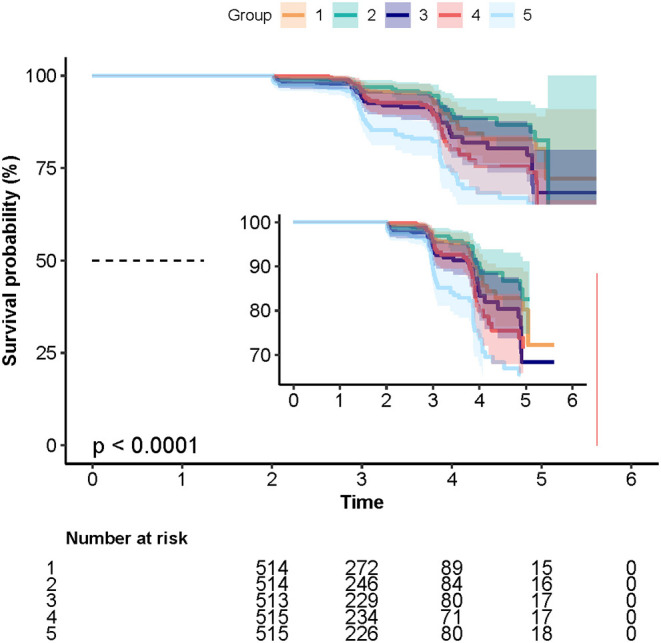
Figure 1.

The Kaplan–Meier curves depicting the cumulative incident type 2 diabetes mellitus (T2DM) in different quintile groups (Q1 to Q5) of triglyceride-glucose (TyG) index. Each color of lines indicates a quintile group. The color range indicates the 95% confidence internval (CI) range of cumulative incidence of T2DM at a different follow-up time.
