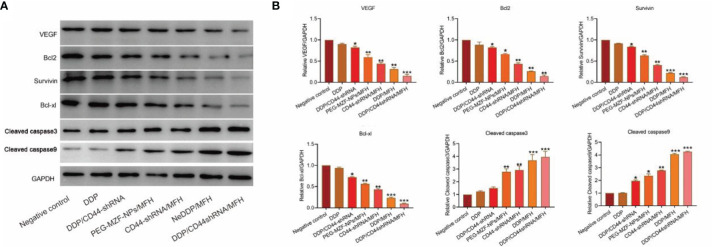
Figure 7.
VEGF, survivin, Bcl-2, Bcl-xl, cleaved caspase-3, and cleaved caspase-9 protein expression of tumor tissues from nude mice bearing xenograft ovarian cancer in each treatment group tested by Western blot. (A) The protein bands. (B) Quantitative statistical results according to the protein bands. *p < 0.05, **p < 0.01 vs. that of negative control group. ***p < 0.001 v.s. negative control.

