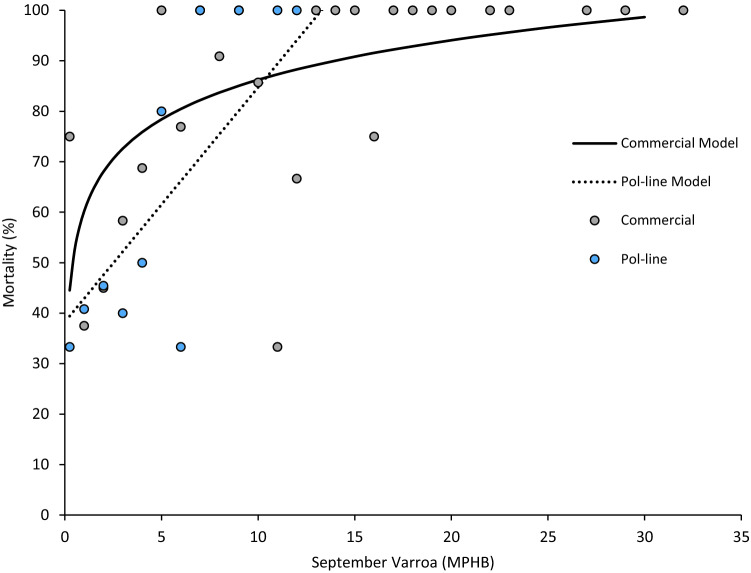
Figure 6.
Predictive relationship between September Varroa levels and colony mortality (NCommercial = 167, NPol-line = 157). Points are based on binned data from all colonies falling into a Varroa stratum, and concordant percentage mortality. Colours (Commercial, grey; Pol-line, blue), and line types (Commercial, solid; Pol-line, dashed), indicate stock. Lines are fit against the binned data for each stock (Commercial, R2 = 0.349, Pol-line, R2 = 0.647).

