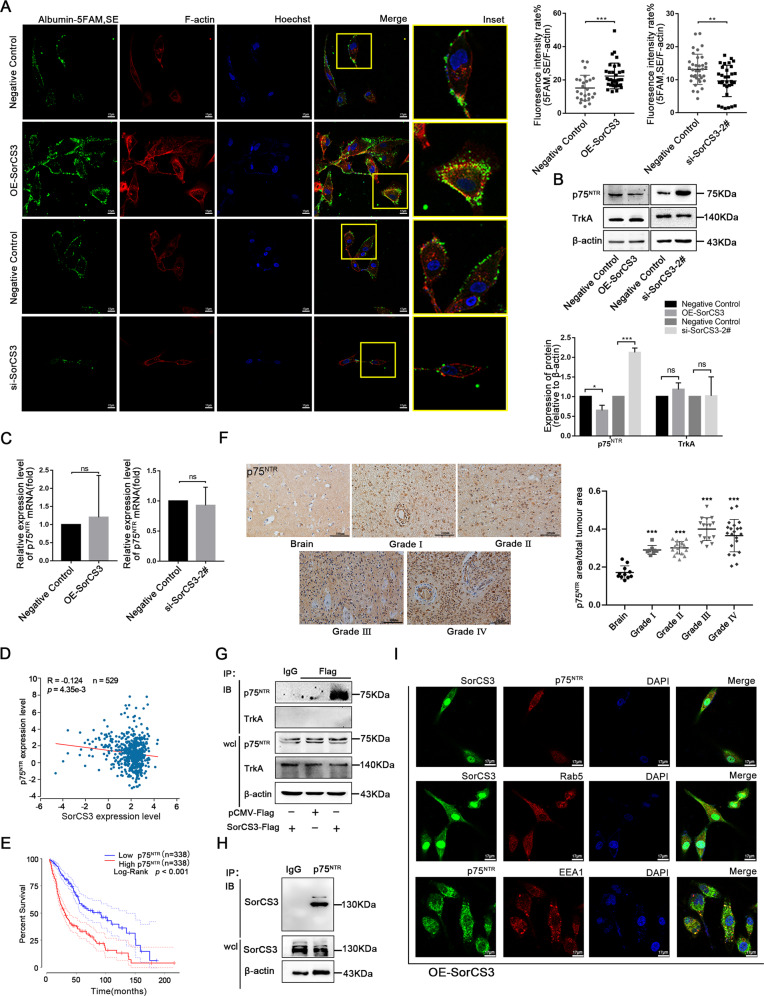
Fig. 4. SorCS3 regulates p75NTR expression and internalization.
A Confocal microscopy images of live cells were treated with Albumin-labeled 5-FAM,SE in altered SorCS3 expression condition. Scale bar: 17 µm. B, C qPCR and Western blot analysis of p75NTR and TrkA levels after altering the expression of SorCS3 in U87 cells. D Correlation between SorCS3 and p75NTR mRNA expression levels were analyzed using starBase v2.0 (n = 529, R = −0.124, p = 4.35e-3). E Kaplan-Meier survival curves of glioma from TCGA with different p75NTR expression levels (High SorCS3, n = 338; Low SorCS3, n = 338; p < 0.001). F p75NTR expression with different WHO grade glioma and normal brain tissues taken from 108 patients was assessed by IHC. Scale bar: 100 µm. Immunoprecipitations were performed using anti-Flag (G) or p75NTR (H) antibody, and the immunocomplexes were immunoblotted (IB) using anti-SorCS3, p75NTR and TrkA antibody in transfected SorCS3-Flag plasmid. In parallel, immunoblots for SorCS3, p75NTR and TrkA were performed on whole-cell lysates (wcl); the isotypic lane Immunoglobulin G (IgG) represents the IP control. I U87 cells were transfected with SorCS3-Flag plasmid, and then immunolabeled for SorCS3 and markers of the early endosome (Rab5、EEA1) and the p75NTR. Scale bar: 17 µm.

