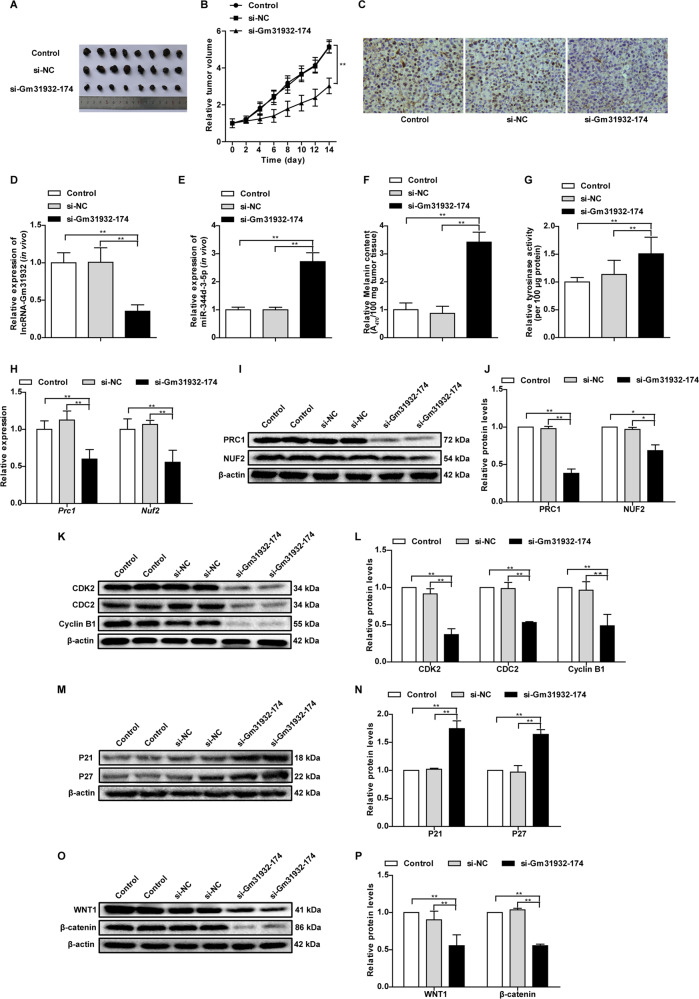
Fig. 6. Effect of silencing lncRNA-Gm31932 on tumor growth and size.
A Representative images of tumor morphology. B Data analysis of tumor volume. C Representative IHC staining of Ki-67 expression in tumors. D Quantitative expression analysis of lncRNA-Gm31932 in tumors by RT-qPCR. E Quantitative expression analysis of miR-344d-3-5p in tumors by RT-qPCR. F Changes in the melanin content of tumors. G Changes in the tyrosinase activity of tumors. H Quantitative expression analyses of Prc1 and Nuf2 in tumors by RT-qPCR. I The protein levels of PRC1 and NUF2 in tumors were determined by western blot. J Quantitative analysis of the protein levels of PRC1 and NUF2 in tumors. K Western blotting for CDK2, CDC2, and Cyclin B1 in tumors. L Quantitative analysis of protein levels of CDK2, CDC, and Cyclin B1 in tumors. M Western blotting of P21 and P27 in tumors. N Quantitative analysis of the protein level of P21 and P27 in tumors. O Western blotting for WNT1 and β-catenin in tumors. P Quantitative analysis of the protein level of WNT1 and β-catenin in tumors. n = 8. Data are presented as the mean ± SD. *P < 0.05, **P < 0.01 compared with the corresponding control group by Student’s t-test.

