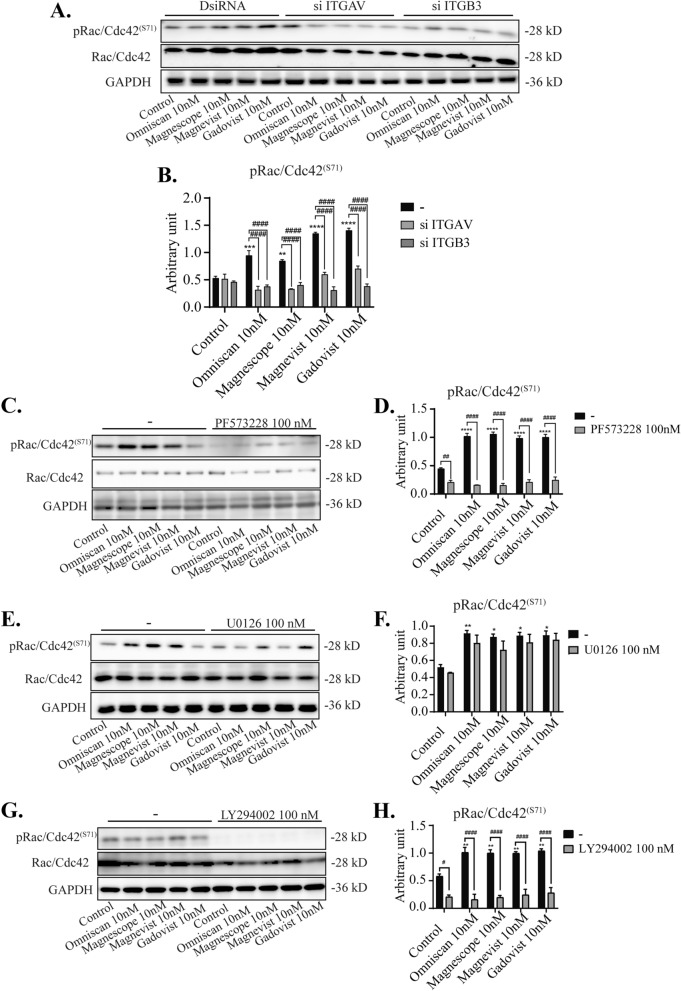
Figure 7.
Effect of GBCAs on phosphorylation of RhoGTPase. The U87MG clonal cells were transfected with DsiRNA or siRNA of ITGAV and/or ITGB3, then exposed to GBCAs for 30 min after serum-starvation for 6 h. Representative blots of pRac1/Cdc42 levels of GBCAs exposure after knockdown of ITGAV or ITGB3 (A) or coexposure with PF573228 (C), U0126 (E), or LY294002 (G). Quantitative analysis of GBCAs effect on the protein expression levels of Rac1/Cdc42 (S71) after knockdown of ITGAV or ITGB3 (B) or coexposure with PF573228 (D), U0126 (F), or LY294002 (H). Full-length blots are available in supplemental information. The blots were quantified using Fiji ImageJ software (NIH). Data are expressed as the mean ± SEM of at least three independent experiments. ****p < 0.0001, ***p < 0.001, **p < 0.01, *p < 0.05, indicates statistical significance were analysed by two-way ANOVA continued with post hoc Bonferroni’s or Turkey test compared with the control. ####p < 0.0001, #p < 0.05, indicates statistical significance were analysed by two-way ANOVA continued with post hoc Bonferroni’s or Turkey.

