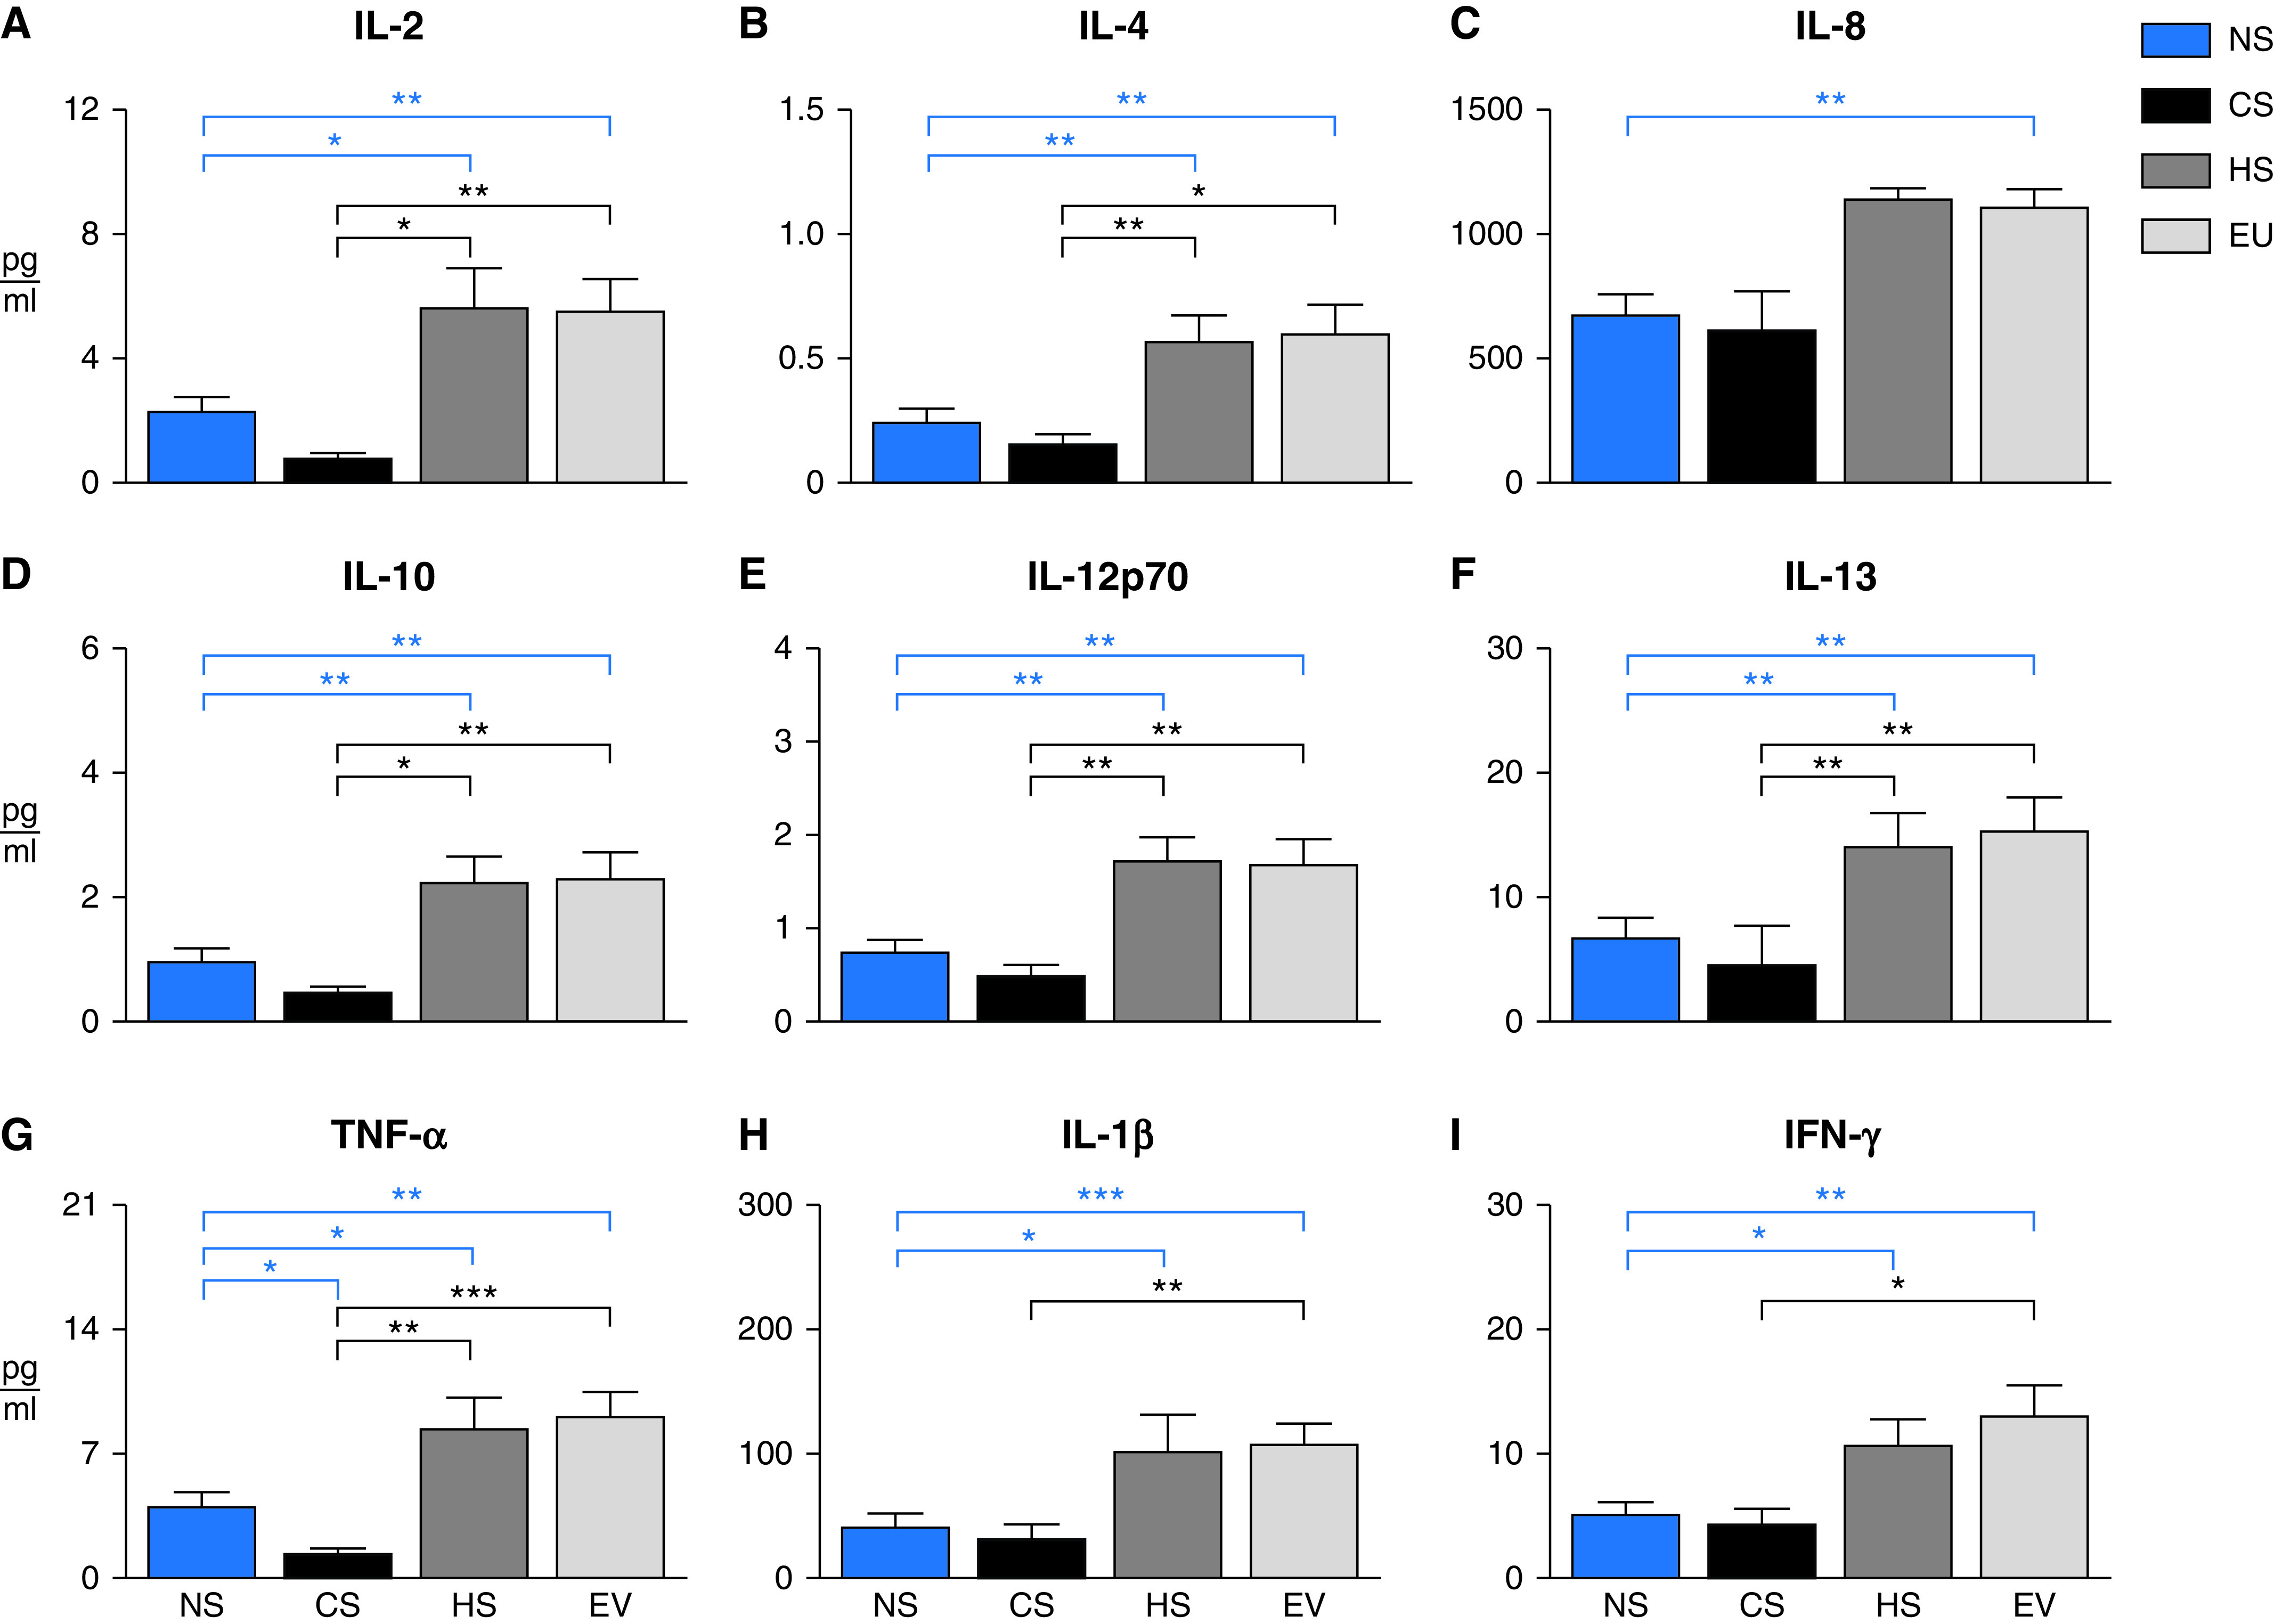
Figure 1.

Aggregate nasal cytokine concentrations stratified by participant tobacco product status: adult nonsmokers (NS; blue, n = 35), cigarette smokers (CS; black, n = 13), hookah smokers (HS; dark gray, n = 13), and e-cigarette users (EU, light gray, n = 19). Data are expressed as cytokine group means (pg/ml) + SEM. Because nasal data failed normality tests, a Kruskal-Wallis test was used to identify mean differences. When P ⩽ 0.05, a post hoc Dunn’s multiple comparisons test was used to identify which groups were different from one another. Blue lines indicate when means were statistically different from NS reference group (i.e., negative control). Black lines indicate when means were statistically different from CS reference group (i.e., positive control). *P ⩽ 0.05, **P ⩽ 0.01, and ***P ⩽ 0.001.
