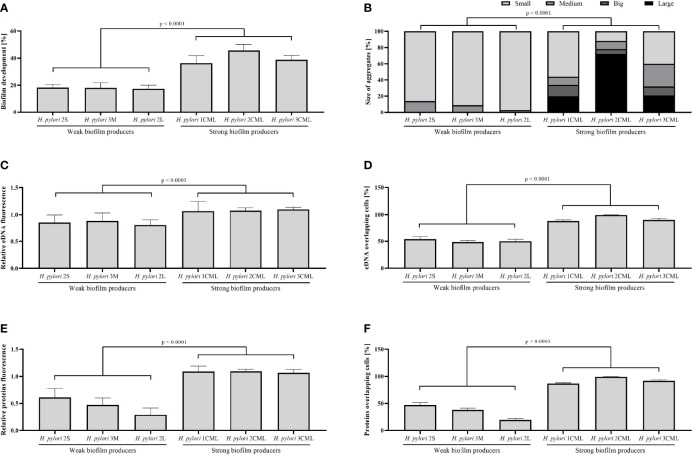
Figure 4.
Numerical data obtained by the analysis of biofilms produced by six selected H. pylori incubated for 24 h under microfluidic conditions. The data include biofilm development (A), size of aggregates with biofilm (B), relative fluorescence of eDNA (C) and proteins (E), and a percentage rate of eDNA (D) and proteins (F) overlapping bacterial cells in biofilms. The development of biofilm was determined based on the degree of microcapillary coverage. The fluorescence intensity of eDNA or proteins was normalized to fluorescence of the cellular biomass. The amount of eDNA or proteins overlapping bacterial cells was calculated based on the degree of co-localization of fluorescence signals and indicated the rate of bacterial coverage by the matrix components. The size of aggregates was normalized to dimensions of the microcapillary canal in the examined photo and clusters of bacterial cells corresponding to > 1%, 1% - 0.5%, 0.5% - 0.1% and < 0.1% of the microcapillary size were categorized as large, big, medium and small, respectively. The total area occupied by aggregates of a give category was calculated and presented as a percentage share in all aggregates formed. The microfluidic assays were performed in six biological replications with three technical repetitions constituting three different fragments of microcapillaries (n = 18/strain).

