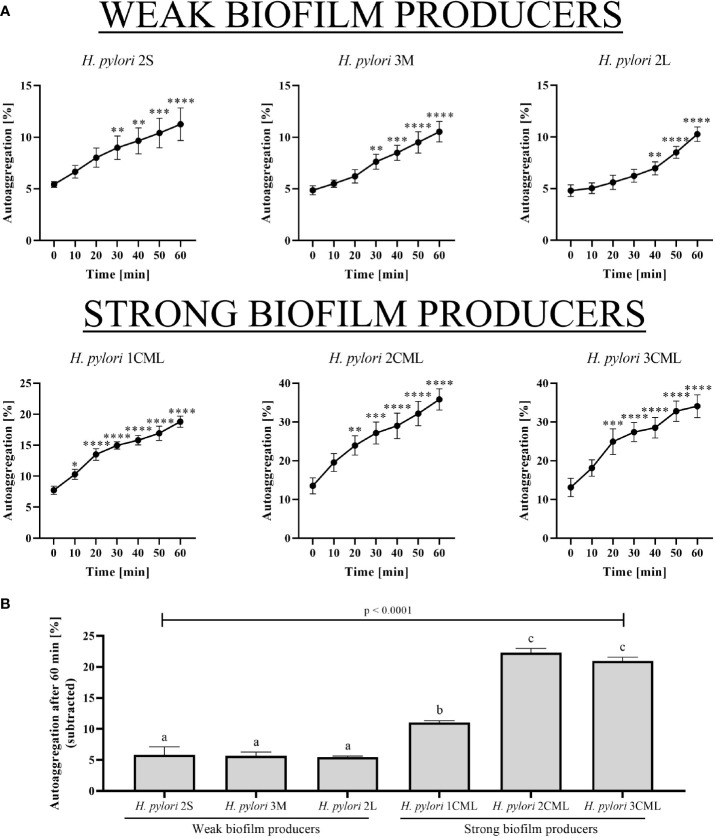
Figure 5.
The time-dependent autoaggregation capacity of six selected H. pylori strains (A) and the final autoaggregation rate obtained after a 1-h incubation (B). The analysis was performed by observing the rate of coverage of the microscopy observation field in the obtained photos. The autoaggregation rate after 1 h was calculated by subtracting the initial autoaggregation value in the sample (T0). In the figure (A), p-values represented by *, **, ***, and **** are equal to < 0.05, < 0.01, < 0.001, and < 0.0001, respectively. In the figure (B), columns with the same subscript letters (a, b, c) are not significantly different from each other (p > 0.05). The tests was performed in three biological replications (n = 3/strain).

