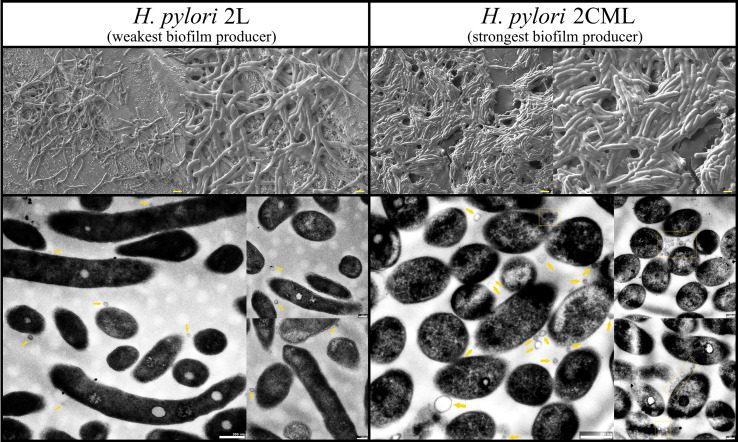
Figure 6.
Representative SEM (top) and TEM (bottom) photographs of bacterial aggregates formed after a 1-h incubation of H. pylori 2L and H. pylori 2CML strains. The arrows point a single OMV, while the squares with a dashed line indicate a grouping of these structures. Scale bars for SEM show 2 µm and 1 µm for low- and high-magnification pictures, respectively.

