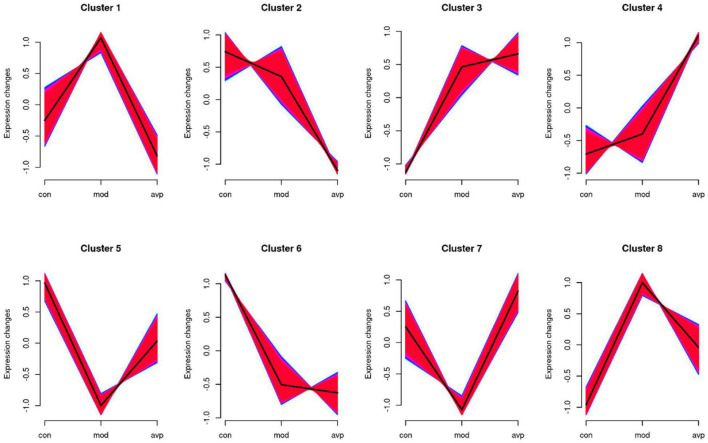
FIGURE 11.
The series of diagrams illustrates the patterns of dynamic changes of gene in each group. Clusters 1 and 8 presented a trend of increasing in the VPA-induced autism model group and decreasing in the AVP group. Clusters 5 and 7 presented a trend of decreasing in the VPA-induced autism model group and increasing in the AVP group. Clusters 2 and 6 presented a trend of gradually declining in the VPA-induced autism model group and AVP group, and clusters 3 and 4 presented a trend of continuous increase in the VPA-induced autism model group and AVP group.

