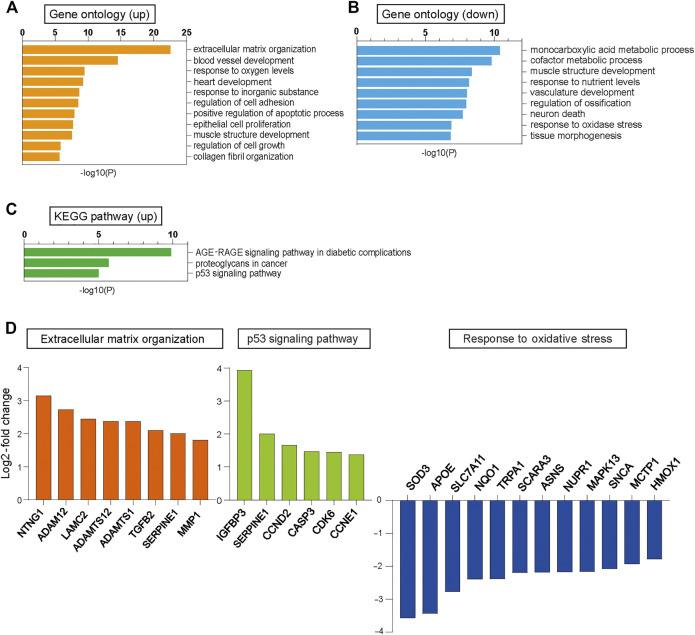
FIGURE 2.
RNA-seq analysis in CUGexp− and CUGexp+ cells. (A) Bar graphs displaying the GO categories showing significant enrichment among the upregulated genes in cells expressing CUGexp (CUGexp+) at day 51. (B) Bar graphs displaying the GO categories showing significant enrichment among the downregulated genes in CUGexp+ cells at day 51. (C) Bar graphs displaying the Kyoto Encyclopedia of Genes and Genomes (KEGG) pathways showing significant enrichment for upregulated genes in CUGexp+ cells. (D) Expression levels of representative upregulated or downregulated genes in CUGexp+ cells involved in ECM organization (orange), p53 signaling pathway (green), and response to oxidative stress (blue).

