
Figure 4.
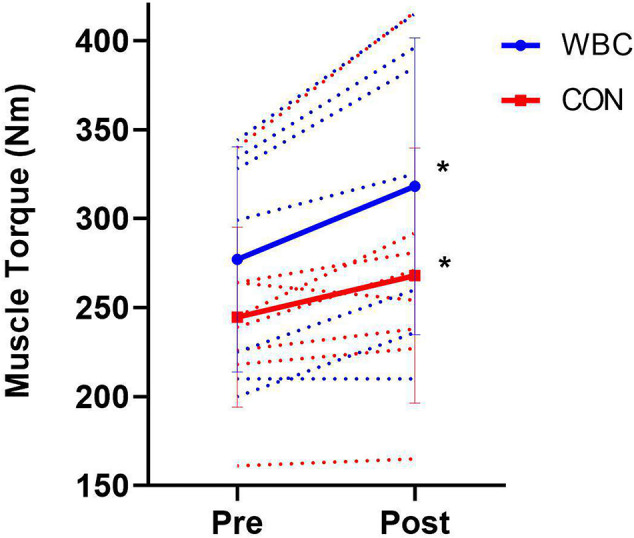
Leg muscle torques for WBC (n = 7) and CON (n = 9) before and after 6 week training programme. *p ≤ 0.05 for increase in both groups. Solid lines present means ± standard deviations. Dotted lines present individual participant responses. N = 16.