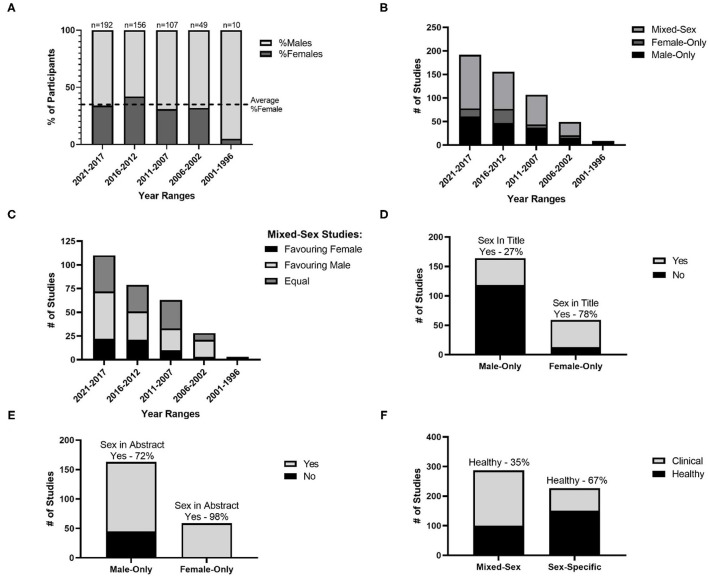
Figure 3.
Sex-specific inclusion. (A) Average percentage of female and male participants from studies in cohorts of 5 years with the dotted line as the average over all studies; (B) Number of male-only, female-only and mixed-sex studies in cohorts of 5 years; (C) Number of mixed-sex studies with equal male-female participants, unequal participants favoring females and unequal participants favoring males, over cohorts of 5 years; (D) Number of male-only and female-only studies including sex in the article title; (E) Number of male-only and female-only studies including sex in the article abstract; (F) Number of studies in mixed-sex and sex-specific groups for healthy and clinical populations.

