
FIGURE 1.
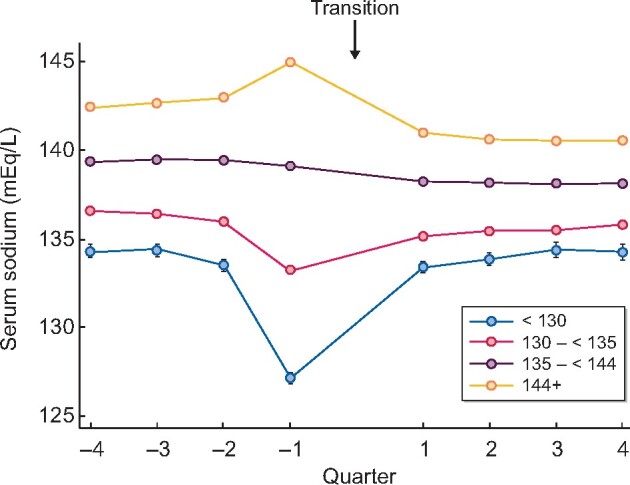
Trajectories of quarterly averaged sodium 1 year pre-transition (−4 quarters) and 1 year post-transition (4 quarters) to ESKD stratified by 3-month pre-ESKD serum sodium groups.
Official websites use .gov
A
.gov website belongs to an official
government organization in the United States.
Secure .gov websites use HTTPS
A lock (
) or https:// means you've safely
connected to the .gov website. Share sensitive
information only on official, secure websites.
Trajectories of quarterly averaged sodium 1 year pre-transition (−4 quarters) and 1 year post-transition (4 quarters) to ESKD stratified by 3-month pre-ESKD serum sodium groups.