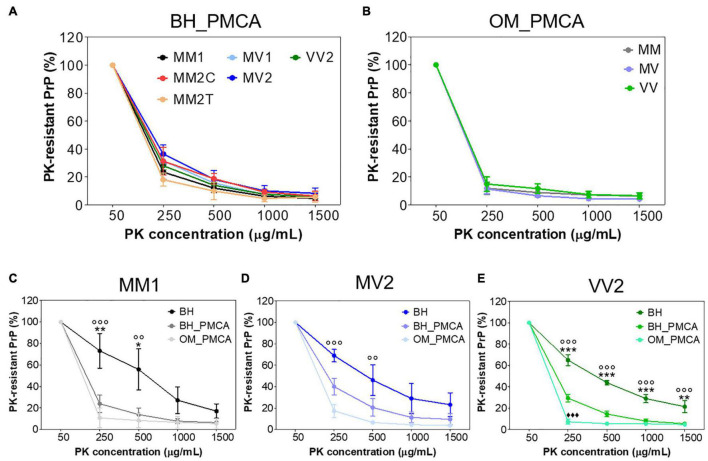
FIGURE 4.
PK resistance analysis of BH and their amplified products collected at the 6th PMCA round. (A) PK resistant profiles of all sCJD brain amplified products (BH_PMCA) did not show statistically significant differences. (B) PK resistant profiles of all sCJD OM amplified products (OM_PMCA) did not show statistically significant differences. (C) PK resistant profiles of BH, BH_PMCA and OM_PMCA of MM1 patients showing statistically significant differences only between BH and BH_PMCA or BH and OM_PMCA. (D) PK resistant profiles of BH, BH_PMCA and OM_PMCA of MV2 patients showing statistically significant differences only between BH and OM_PMCA. (E) PK resistant profiles of BH, BH_PMCA and OM_PMCA of VV2 patients showing statistically significant differences between BH, BH_PMCA and OM_PMCA. Statistical analyses: repeated measure analysis of variance (ANOVA); BH vs. BH_PMCA: *p < 0.05, **p < 0.01, ***p < 0.001, BH vs. OM_PMCA: °°p < 0.01, °°°p < 0.001 and BH_PMCA vs. OM_PMCA ◆◆◆p < 0.001; error bars: ± standard error of the mean [SEM].

