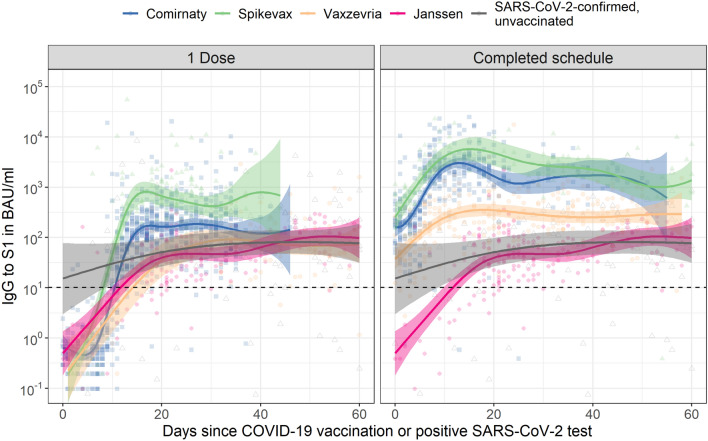
Figure 1.
Spike S1 immunoglobulin G (IgG) kinetics following COVID-19 vaccination by number of doses and vaccine brand in SARS-CoV-2-naive adults aged 18 to 64 years old. The dashed horizontal line represents the threshold for seropositivity. Data for Janssen is duplicated across the two panels to enable direct comparison with the other vaccine brands after one dose and a completed vaccination schedule. For comparison, IgG concentrations following a positive SARS-CoV-2 PCR or antigen test in unvaccinated participants are shown alongside vaccination responses; data is duplicated in both panels (for details see Supplementary Table S3). Fit and 95% confidence bands are shown from a Generalized Additive Model, using penalized splines, with only time since dose in days as explanatory variable. For results of multivariable models, see Supplementary Table S1. BAU/mL: binding antibody units per mL; IgG: immunoglobulin G.

