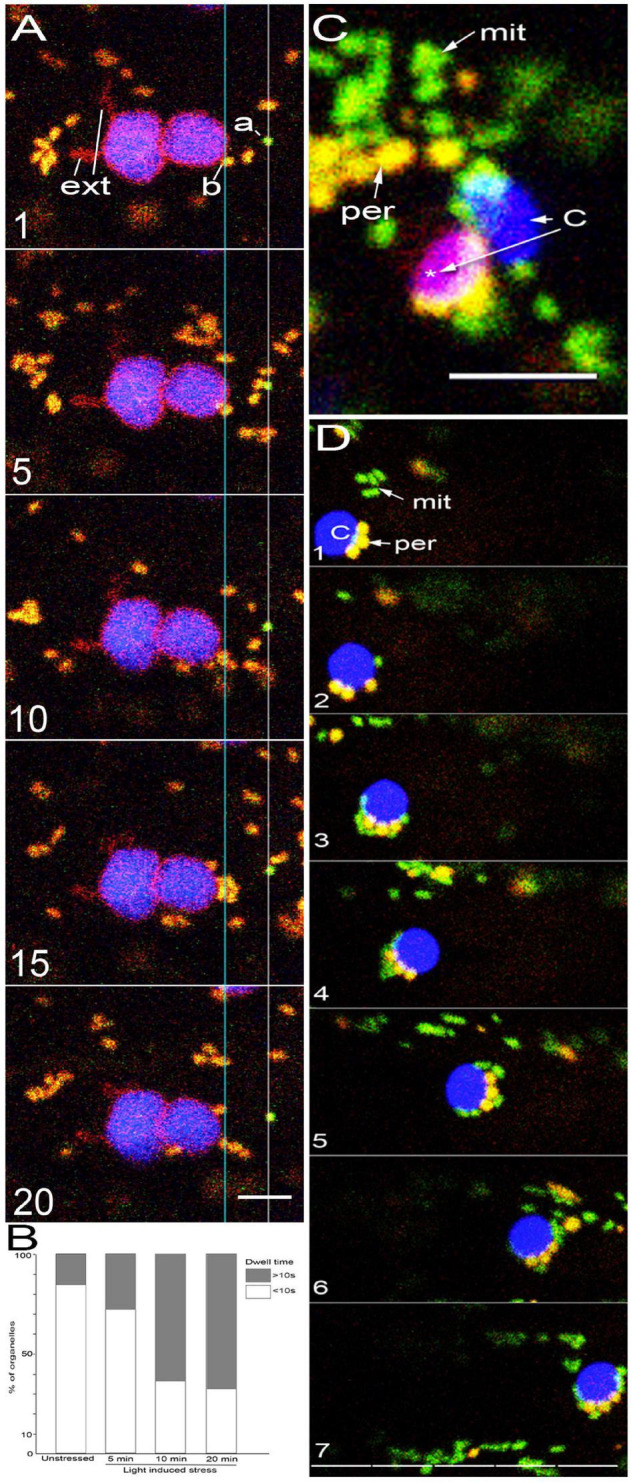
FIGURE 1.

Several different possibilities for organelle interactions are observed in living cells. (A) Five snapshots used to illustrate the ideas of coincidental interactions, sustained proximity based on long dwell time and no possible direct interactions when chloroplasts, peroxisomes and mitochondria clearly remain at a distance from each other. The consecutive images are from 100 frames representing about 200 s of imaging (Supplementary Movie 1). A peroxisome labeled “a” maintains its position at a distance from the two chloroplasts observed for 100 frames. A mitochondrion labeled “b” maintains a position at or within 500 nm of the plastid OEM for 100 frames or a total dwell time of 200 s. During this time up to 6 other mitochondria cluster near it but the cluster is maintained only for a maximum of 45 frames or dwell time of 90 s. Other than one mitochondrion that is present close to the plastid OEM during the 200 s, the rest do not exhibit sustained proximity with the plastid or with a peroxisome. The single instance of a peroxisome and mitochondria appearing in frame 15 and the several frames with mitochondrial clusters are considered coincidental occurrences. Notably, two extensions (ext) are present in the chloroplast (C) but neither mitochondria or peroxisomes exhibit sustained proximity with them. (B) In unstressed plants, on the basis of 100 peroxisome and mitochondrial clusters with chloroplasts a dwell-time of less than 10 s (ca. 5 frames of our confocal scans) was arrived at for 83 clusters while the rest exhibited dwell time longer than 10 s. High light intensity induced stress by exposing plants for 5 min to light of 450 ± 25 μmol m–2s–2 resulted in the three organelle clusters with a dwell-time greater than 10 s to 29% Longer exposures of 10 and 20 min resulted the three-organelle cluster with dwell-time longer than 10 s to increase to 64 and 67%, respectively. (C) Organelles clustered after a 20-min exposure to high light intensity also contain chloroplasts that based on the loss of chlorophyll autofluorescence appear bleached (pink *) compared to an unbleached chloroplast (blue -c). Plastids with degraded chlorophyll often maintained peroxisome clusters for long dwell time. (D) Seven consecutive images illustrating high light induced stress for 10 min that leads to increased proximity between the chloroplasts (blue -C), peroxisomes (per – yellow) and mitochondria (mit – green). A split scale bar with each unit representing 10 μm shows that the clustered organelles remained together as they moved for at least 50 μm. Scale bars – A = 5; C, D = 10 μm.
