FIGURE 3.
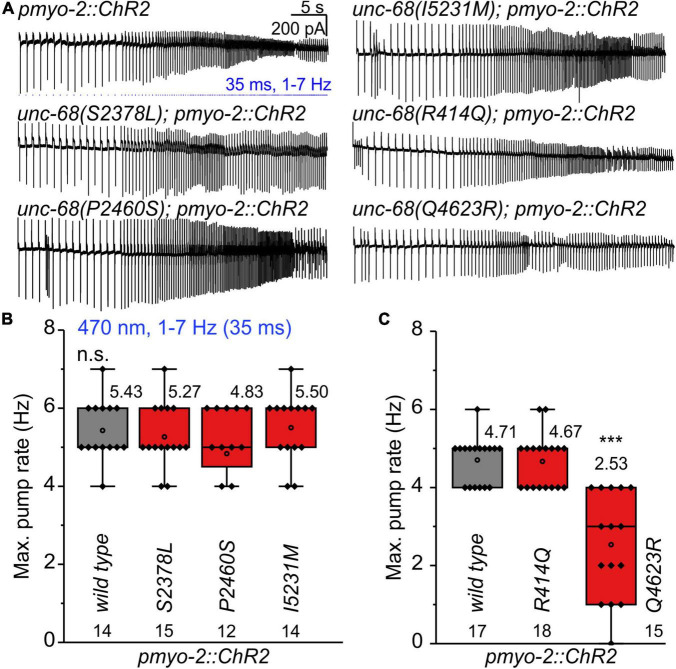
Stress test (1–7 Hz) to determine the maximal pump rate of CPVT mutation-bearing strains. (A) Original recordings of electropharyngeograms (EPGs) obtained by electrophysiological characterization of cut-head preparations. Application of 1 Hz blue light pulses (1.5 mW/mm2, 35 ms) for 15 s followed by a stepwise increase (every 5 s) from 2 to 7 Hz. (B,C) unc-68(Q4623R) shows a reduced maximal pump rate in comparison to wt. Since pharyngeal pump ability sometimes varies among different experimental days, likely due to experimental conditions (room temperature, light-sensitivity of ATR), mutant alleles were always compared to the control animals recorded in the same batch of experiments. Box plots include every data point (rhomb), mean (open circle), and median (line). N-numbers, mean values, and significance levels (asterisks), referring to respective wt controls, are located either below or above the corresponding boxes. One-way ANOVA with the Bonferroni post-hoc test was performed: n.s., not significant, and ***P ≤ 0.001.

