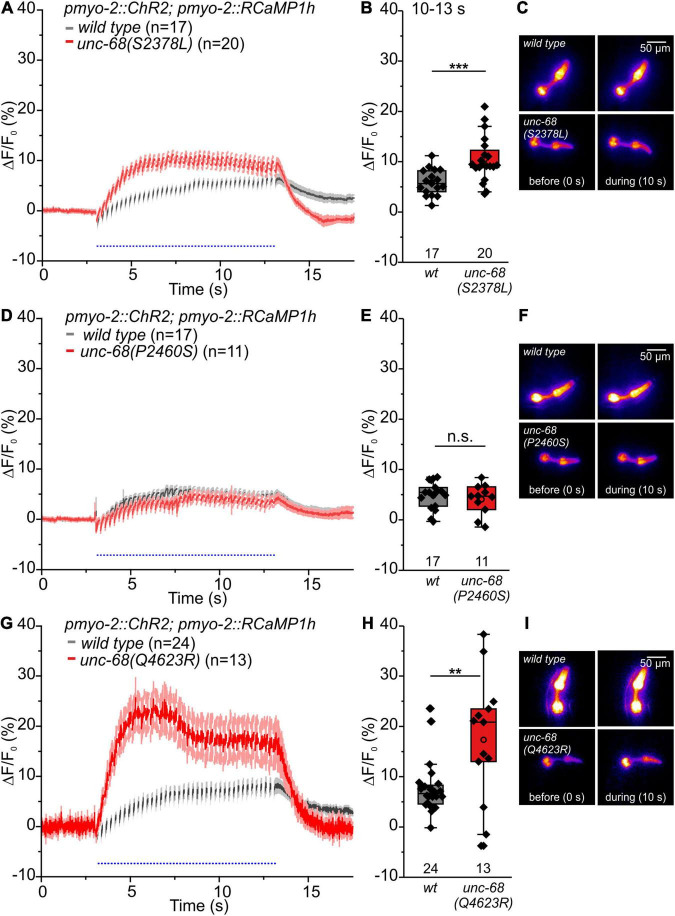
FIGURE 6.
RCaMP1h Ca2+ imaging in PMC reveals effects of CPVT mutations inserted into unc-68 on cytosolic Ca2+ concentration. (A,B,G,H) Alleles Q4623R and S2378L show an increase of ΔF/F0 in comparison to wt animals upon light stimulation (10–13 s). (D,E) Whereas allele P2460S does not exhibit a significant change (10–13 s). (C,F,I) Exemplary false-color representation of fluorescence intensity. Only worms that were able to follow 4-Hz stimulation have been included for analysis. Depicted is the mean of ΔF/F0 (%) with SEM, time periods (∼50 ms), including unspecific peaks induced by blue light stimulation, are not displayed here for better outline (A,D,G). Box plots include every data point (rhomb), mean (open circle), and median (line). N-numbers and significance levels (asterisks) are located either below or above the corresponding boxes. T-test was performed for comparisons of the mean values during the plateau phase of the fluorescence rise (10–13 s): n.s., not significant, **P ≤ 0.01, and ***P ≤ 0.001.

