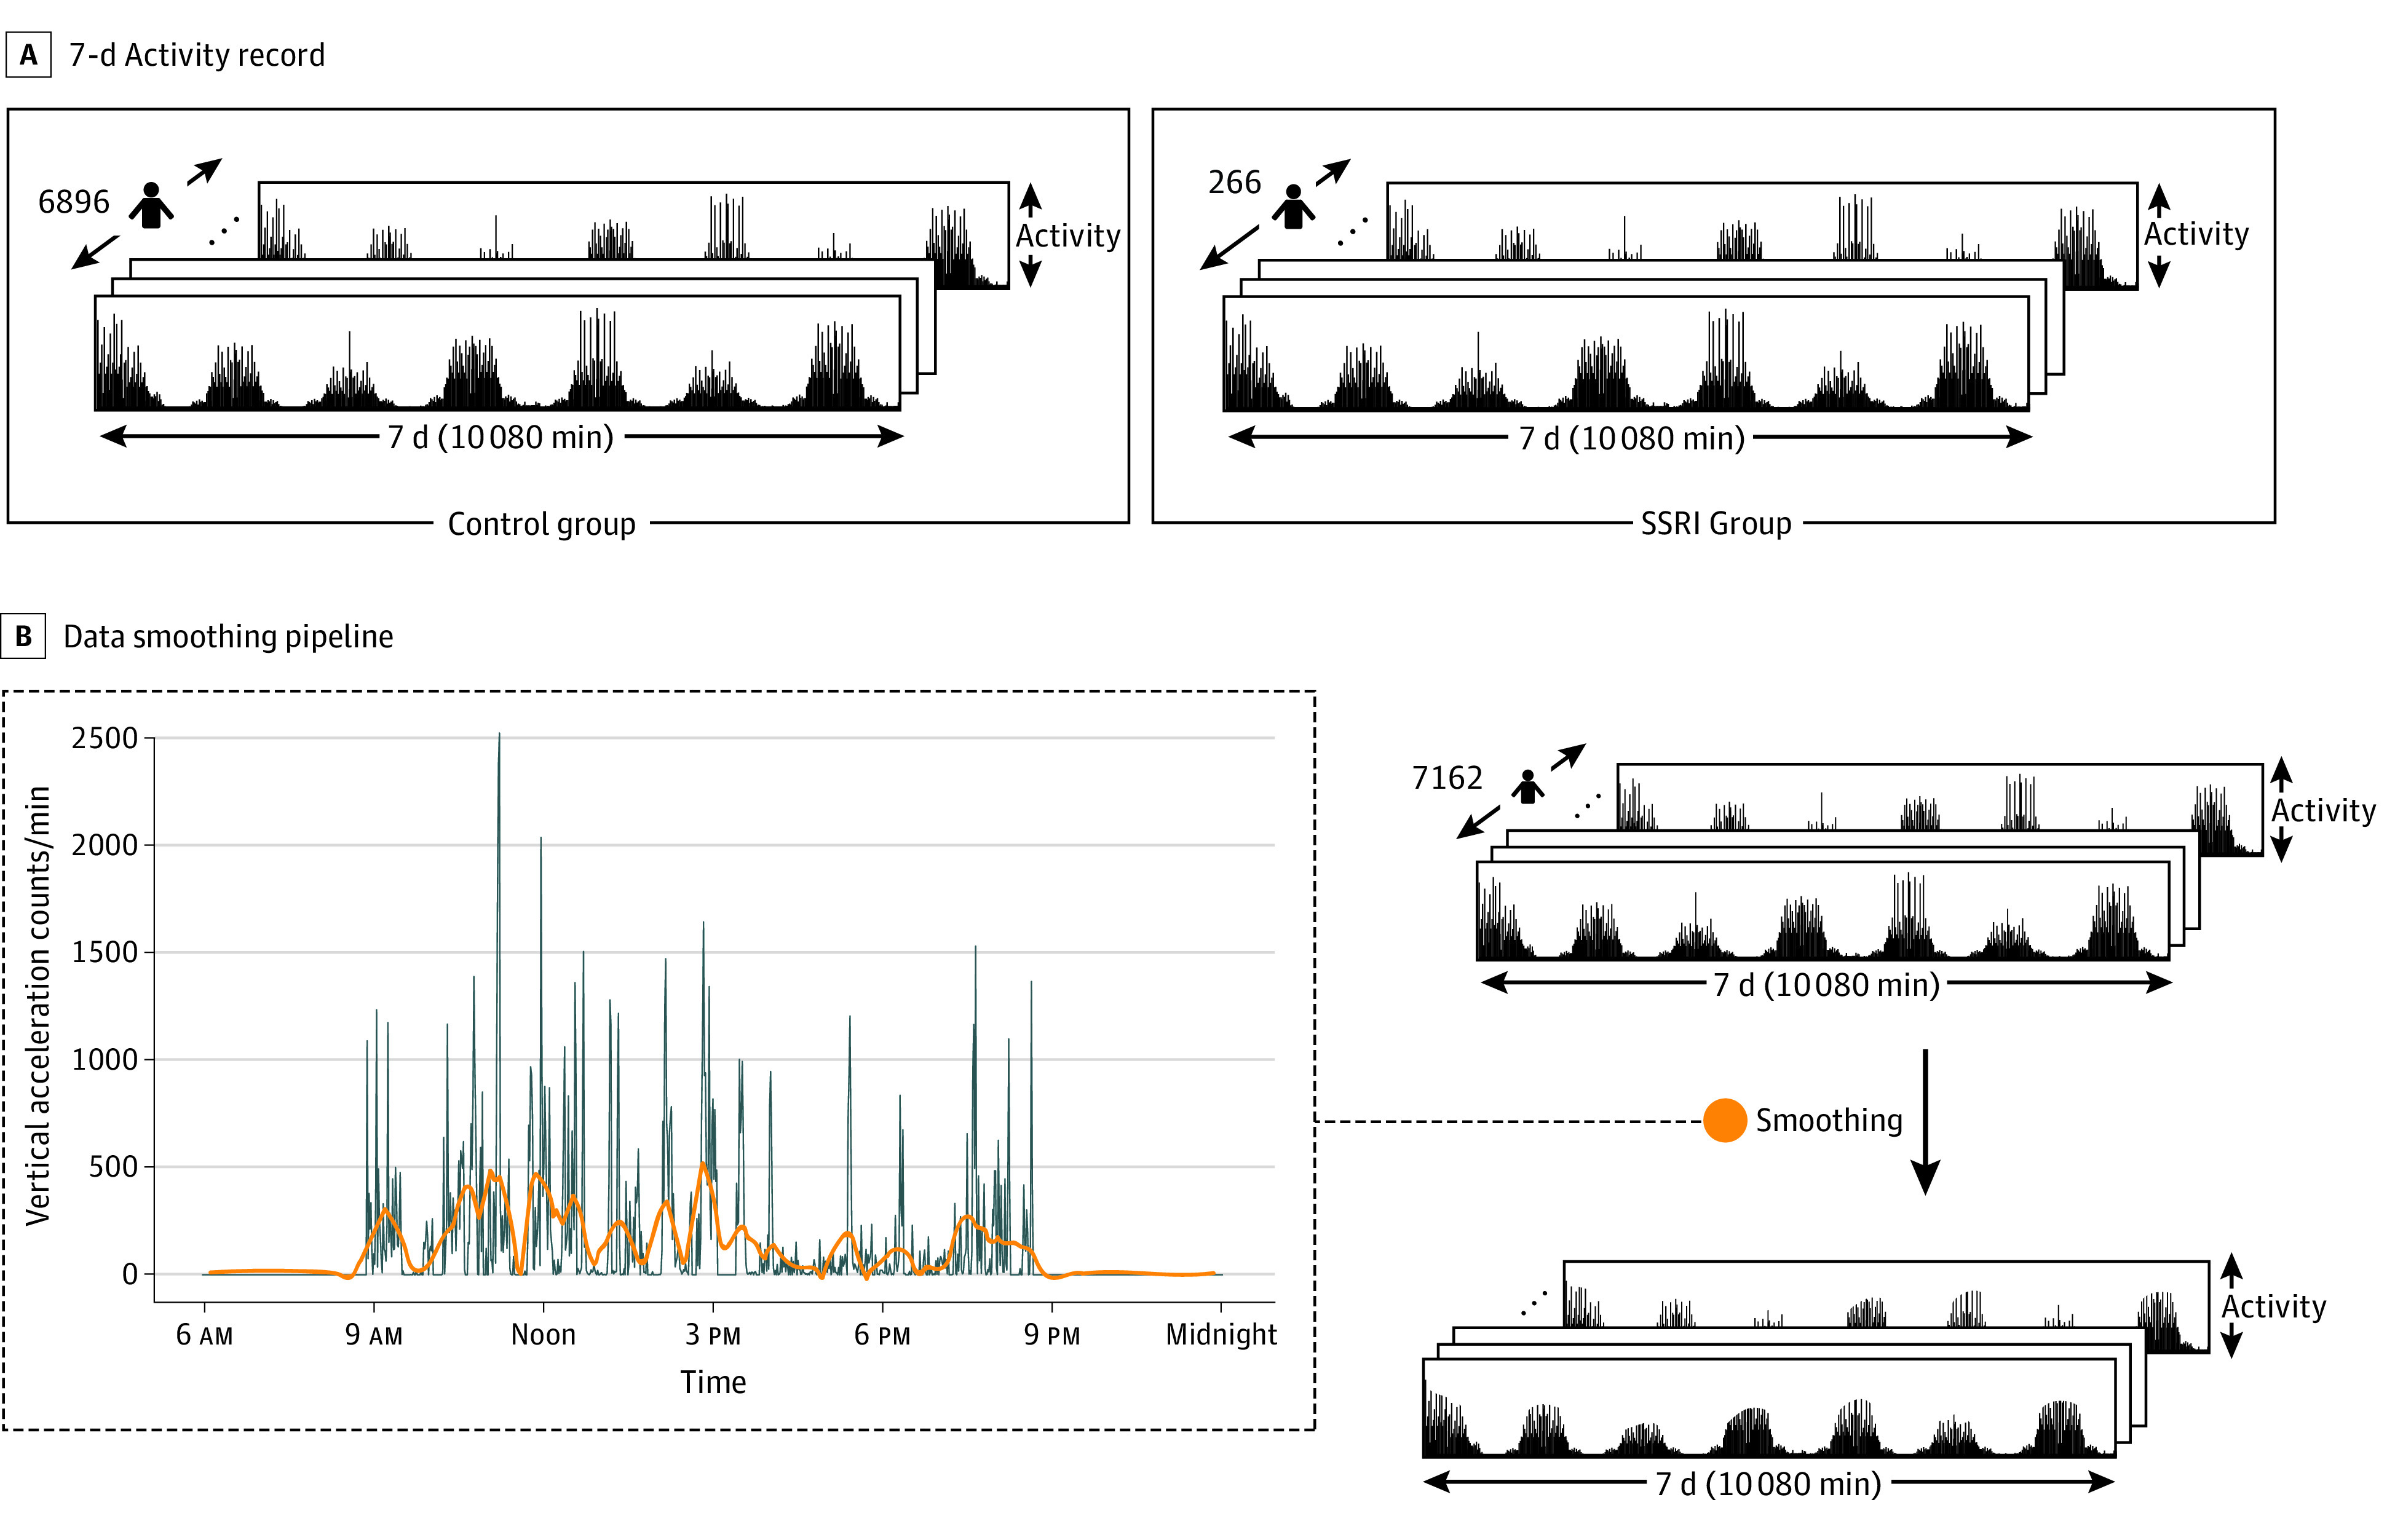
Figure 1. Data Set and Smoothing.

A, Schematic of the 7-day activity record for each participant across the control and selective serotonin reuptake inhibitor (SSRI) groups. The control group contains 6896 individuals, and the SSRI group contains 266 individuals. B, Schematic of the data smoothing pipeline. The left side of the diagram shows a sample of the smoothed activity superimposed on the movement data for 24 hours for 1 participant. After smoothing, there is less noise in the data, allowing for better visualization of trends. The blue line indicates no filter, and the orange line indicates smoothing.
