
Figure 2. Convolutional–Long Short-Term Memory (Conv-LSTM) Pipeline.
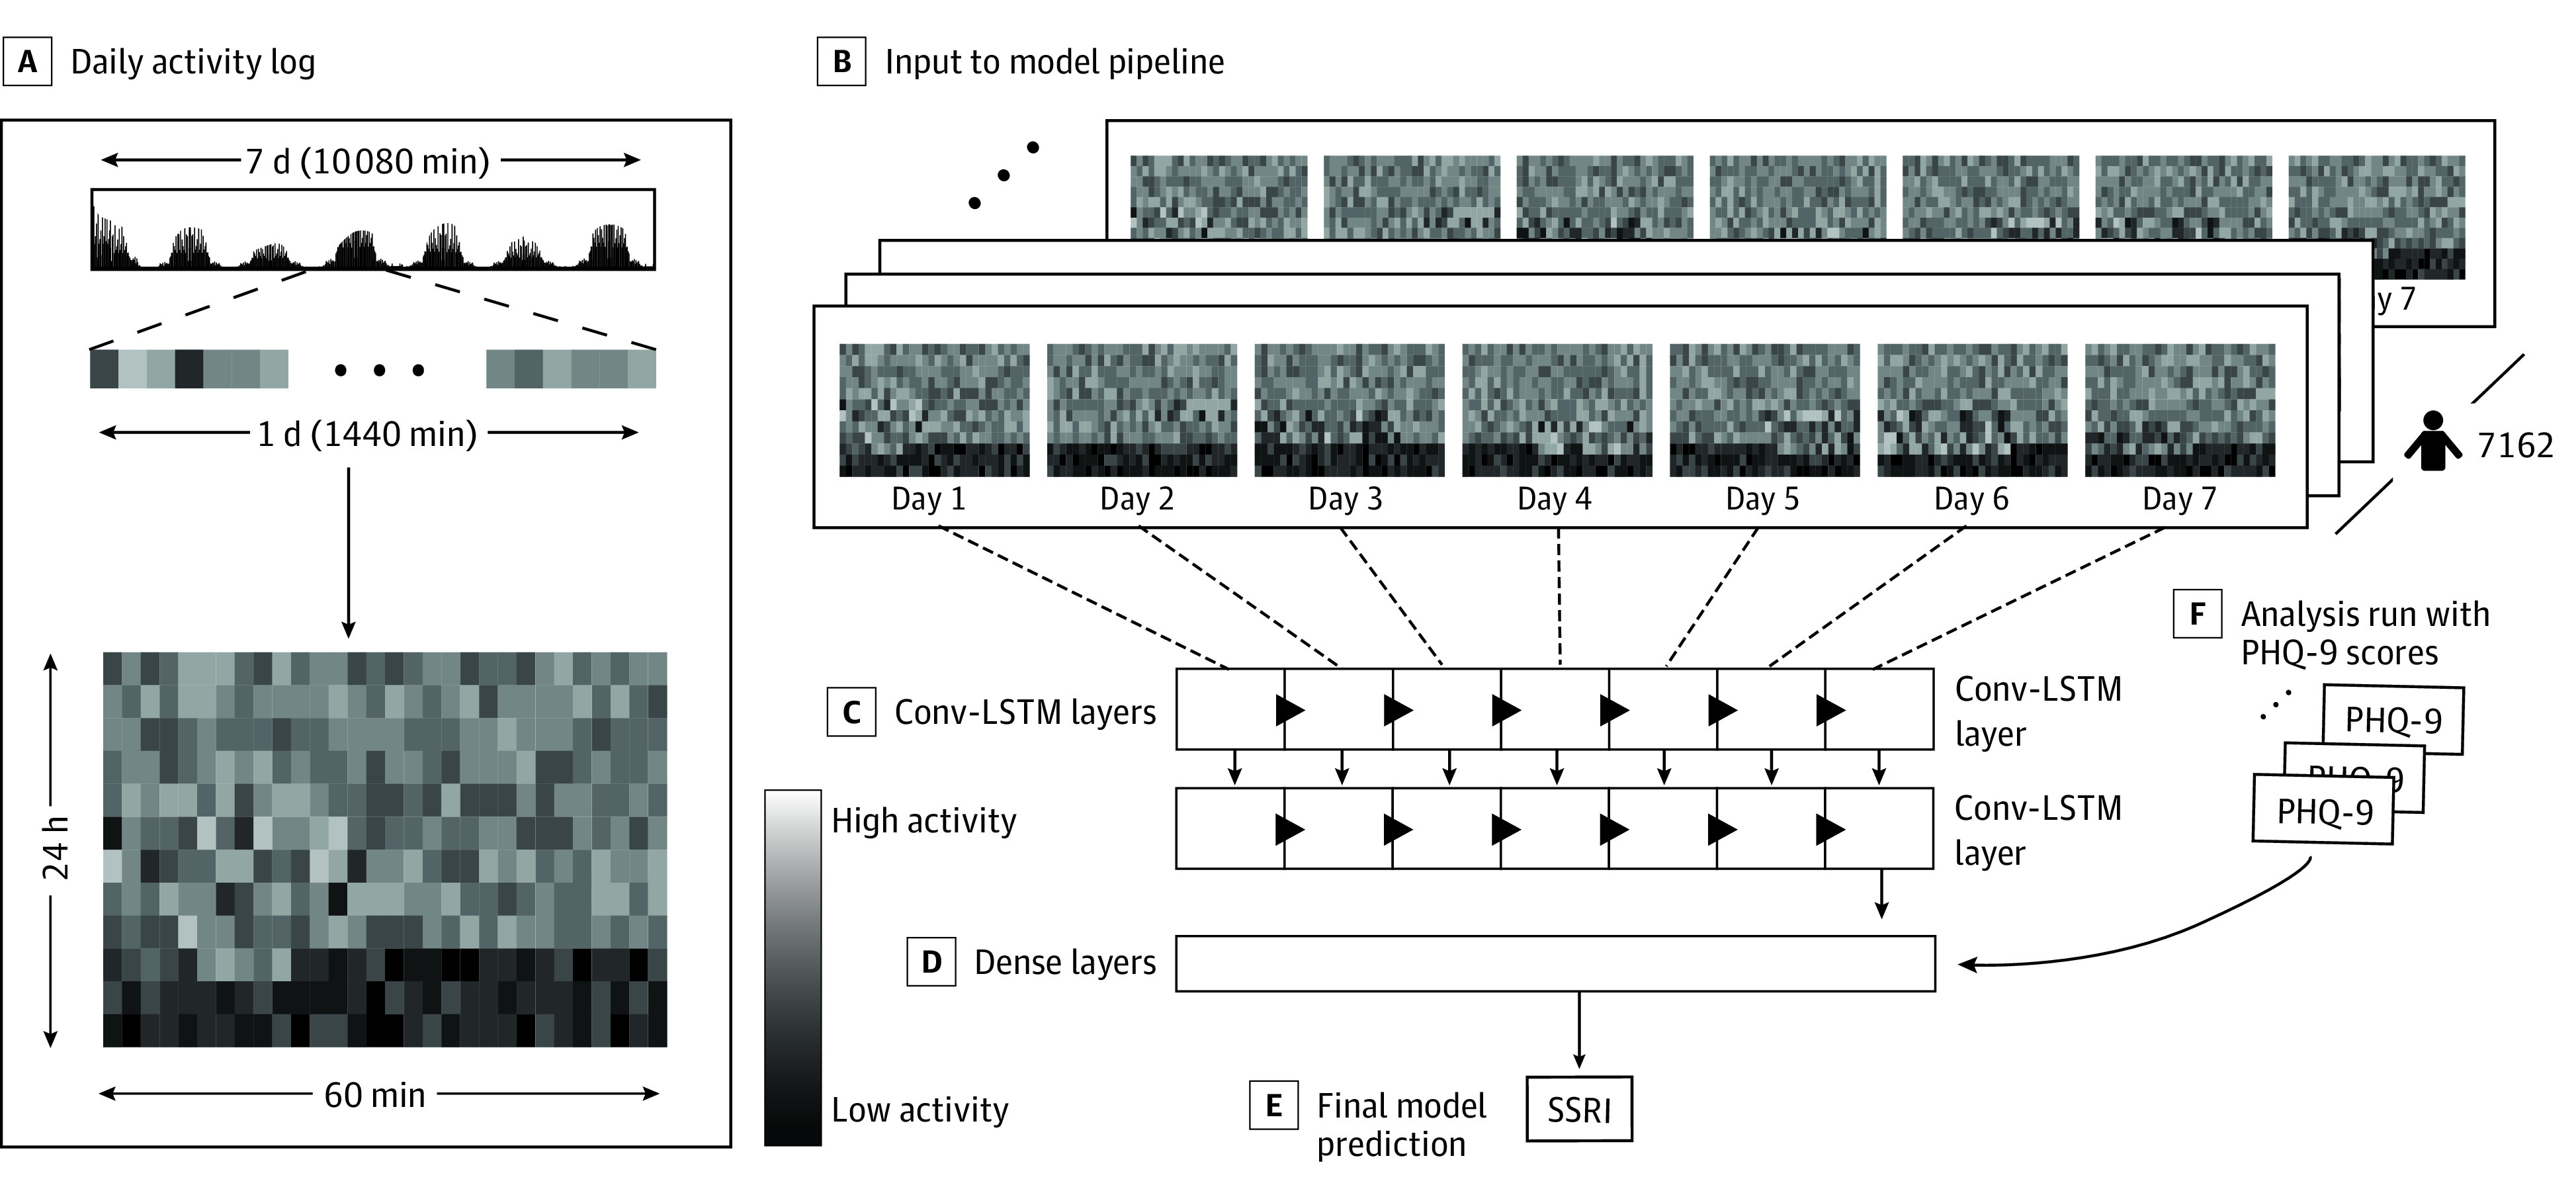
A, The reshaping of the data can be visualized by representing each minute as a box, with the shading inversely associated with the magnitude of activity at that point. A daily activity log is constructed by creating a 60 × 24 matrix, where each row represents 60 minutes. B, The input to the model pipeline comprised a (7162 × 60 × 24 × 7) activity array. This was passed through 2 Conv-LSTM layers (C) and then to a dense layer (D), which outputs the final model prediction (E). F, Analysis was run with 9-item Patient Health Questionnaire (PHQ-9) scores by concatenating the PHQ-9 score to output from the Conv-LSTM layer. SSRI indicates selective serotonin reuptake inhibitor.