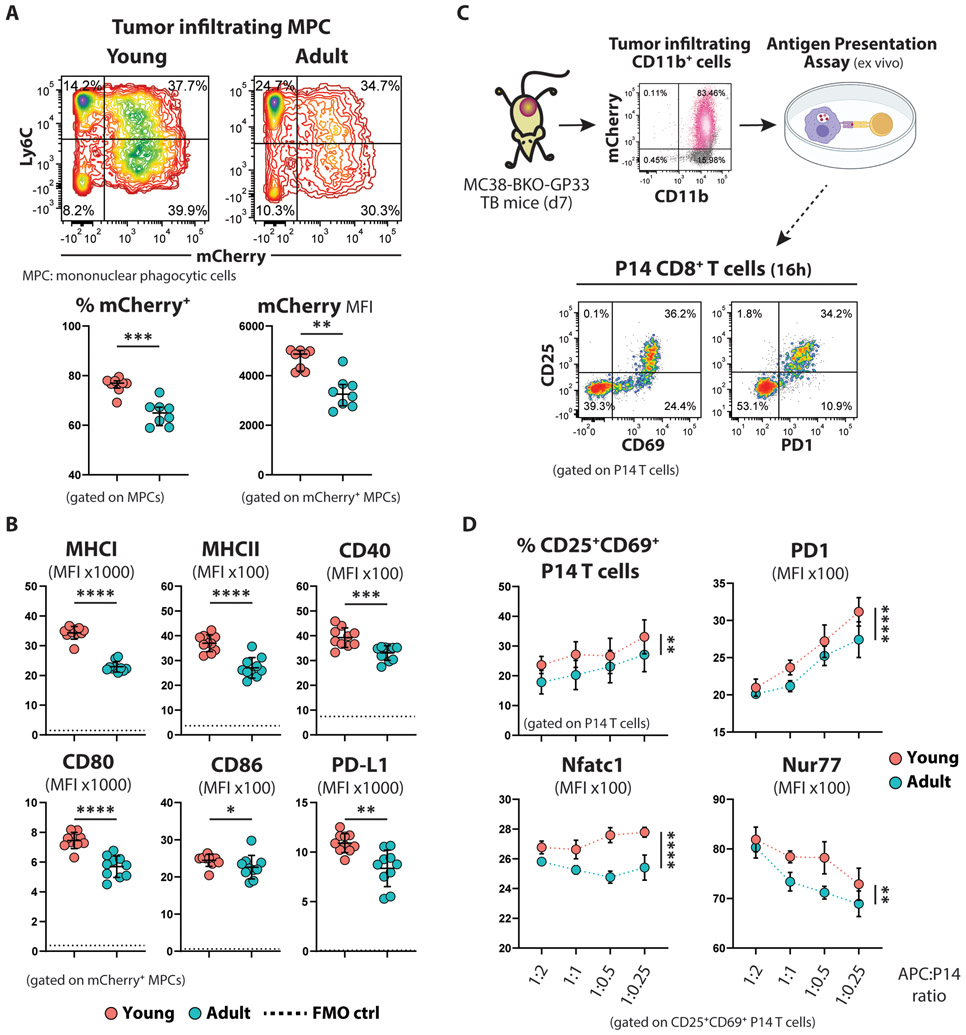
Figure 4. Young tumor infiltrating MPCs are more efficient at cross-presenting tumor antigens.
(A) Representative flow cytometry contour plots (top) and summarized data (bottom; n=8 per group) showing the tumor mCherry uptake by tumor infiltrating mononuclear phagocytotic cells (MPCs). Mean ±SD; unpaired Welch t-test.
(B) Summarized data showing the expression intensity of MHC molecules and costimulatory molecules on the surface of mCherry+ MPCs from young and adult TB mice. The dotted lines represent the autofluorescence calculated based on FMO control samples. Mean ±SD; unpaired Welch t-test.
(C) Schematic experimental design of the antigen cross-presentation assay: CD11b+ myeloid cells isolated from young or adult tumors and normalized for the number of mCherry+ cells were used to stimulate naïve P14 cells ex vivo. Activation of P14 cells was assessed the next day.
(D) Summarized data (n=5 per group) showing the percentage of activated (CD69+CD25+) P14 CD8+ T cells and the expression level of the indicated markers by the activated subset, at different APC:P14 ratios. Mean ±SD; two-way Anova with Sidak correction.
A p-value of <0.05 is regarded as statistically significant, and different levels of significance are represented with asterisks: *P ≤ 0.05, **P ≤ 0.01, ***P ≤ 0.001, and ****P ≤ 0.0001.

