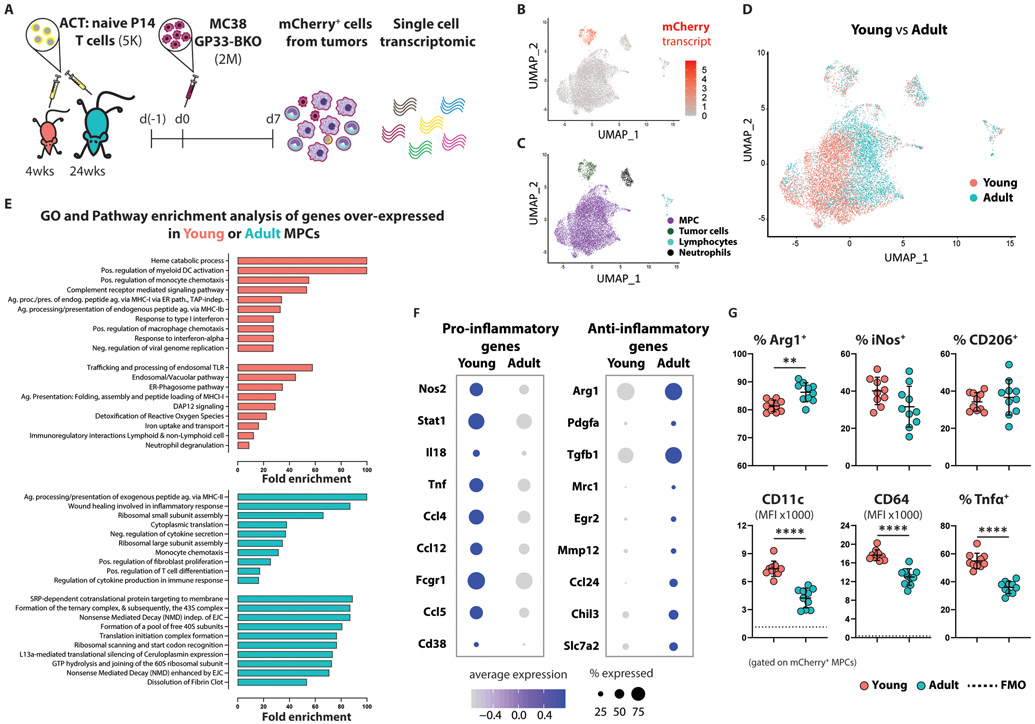
Figure 5. Young tumor infiltrating MPCs are skewed toward a pro-inflammatory phenotype.
(A) Schematic experimental design for isolating antigen+ tumor-associated immune cells.
(B) Single-cell gene expression plot featuring log-scaled mCherry expression levels, which clearly distinguishes tumor from non-tumor cells. Data were projected using Uniform Manifold Approximation and Projection (UMAP) as described in the methods**** (pooled data from 5 mice per experimental group). The experiment was repeated twice with similar results.
(C) Single-cell gene expression analyses revealed distinct clusters corresponding to tumor cells, neutrophils, lymphocytes, and a composite of other myeloid-derived tumor-infiltrating cells (MPCs).
(D) Single-cell gene expression plot with individual cells colored according to the age of their host. Although tumor cells showed no clear evidence of gene expression differences between young and adult cells owing to host age, the majority composite of infiltrating myeloid cells showed extreme gene expression heterogeneity as a function of host age.
(E) Gene ontology (biological processes) and pathway enrichment analysis of genes overexpressed in young (top) or adult (bottom) MPCs. Top 10 enriched terms are presented.
(F) Dot plots representing the average expression of, and percentage of cells expressing, markers commonly used to distinguish pro-inflammatory and anti-inflammatory macrophages. The size of a given dot corresponds to the proportion of cells within the respective group expressing it in any amount, whereas color encodes average expression scaled across all groups presented (an expression value of −1 indicates one standard deviation below the mean).
(G) Summarized data (n=10 per group) showing the expression of proteins associated with polarization of macrophages. Mean ±SD; unpaired Welch t-test.
A p-value of <0.05 is regarded as statistically significant, and different levels of significance are represented with asterisks: *P ≤ 0.05, **P ≤ 0.01, ***P ≤ 0.001, and ****P ≤ 0.0001.

