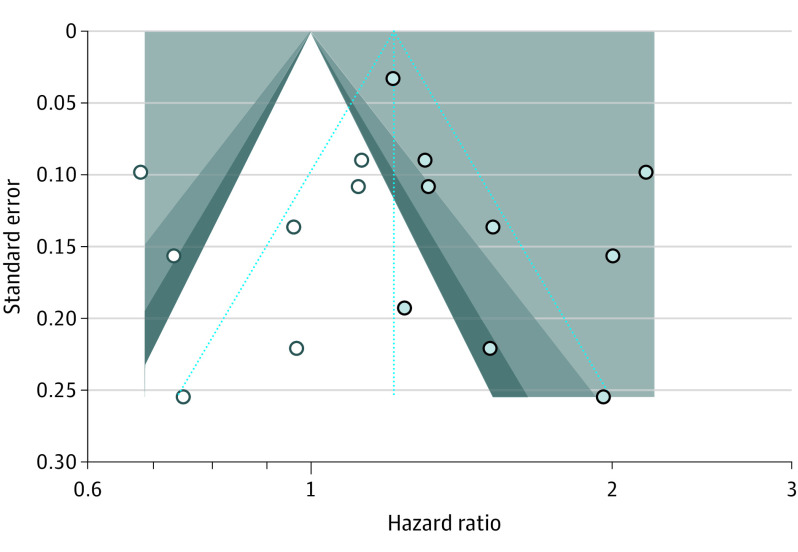
Figure 3. Contour-Enhanced Funnel Plot for the Longitudinal Association of Olfactory Impairment With All-Cause Mortality.
The shaded circles indicate the original study estimates, and the unshaded circles indicate the missing estimate imputed via the trim-and-fill method. Dark gray, gray, and light gray contour lines indicate conventional milestones in levels of statistical significance (P < .10, P < .05, and P < .01, respectively).

