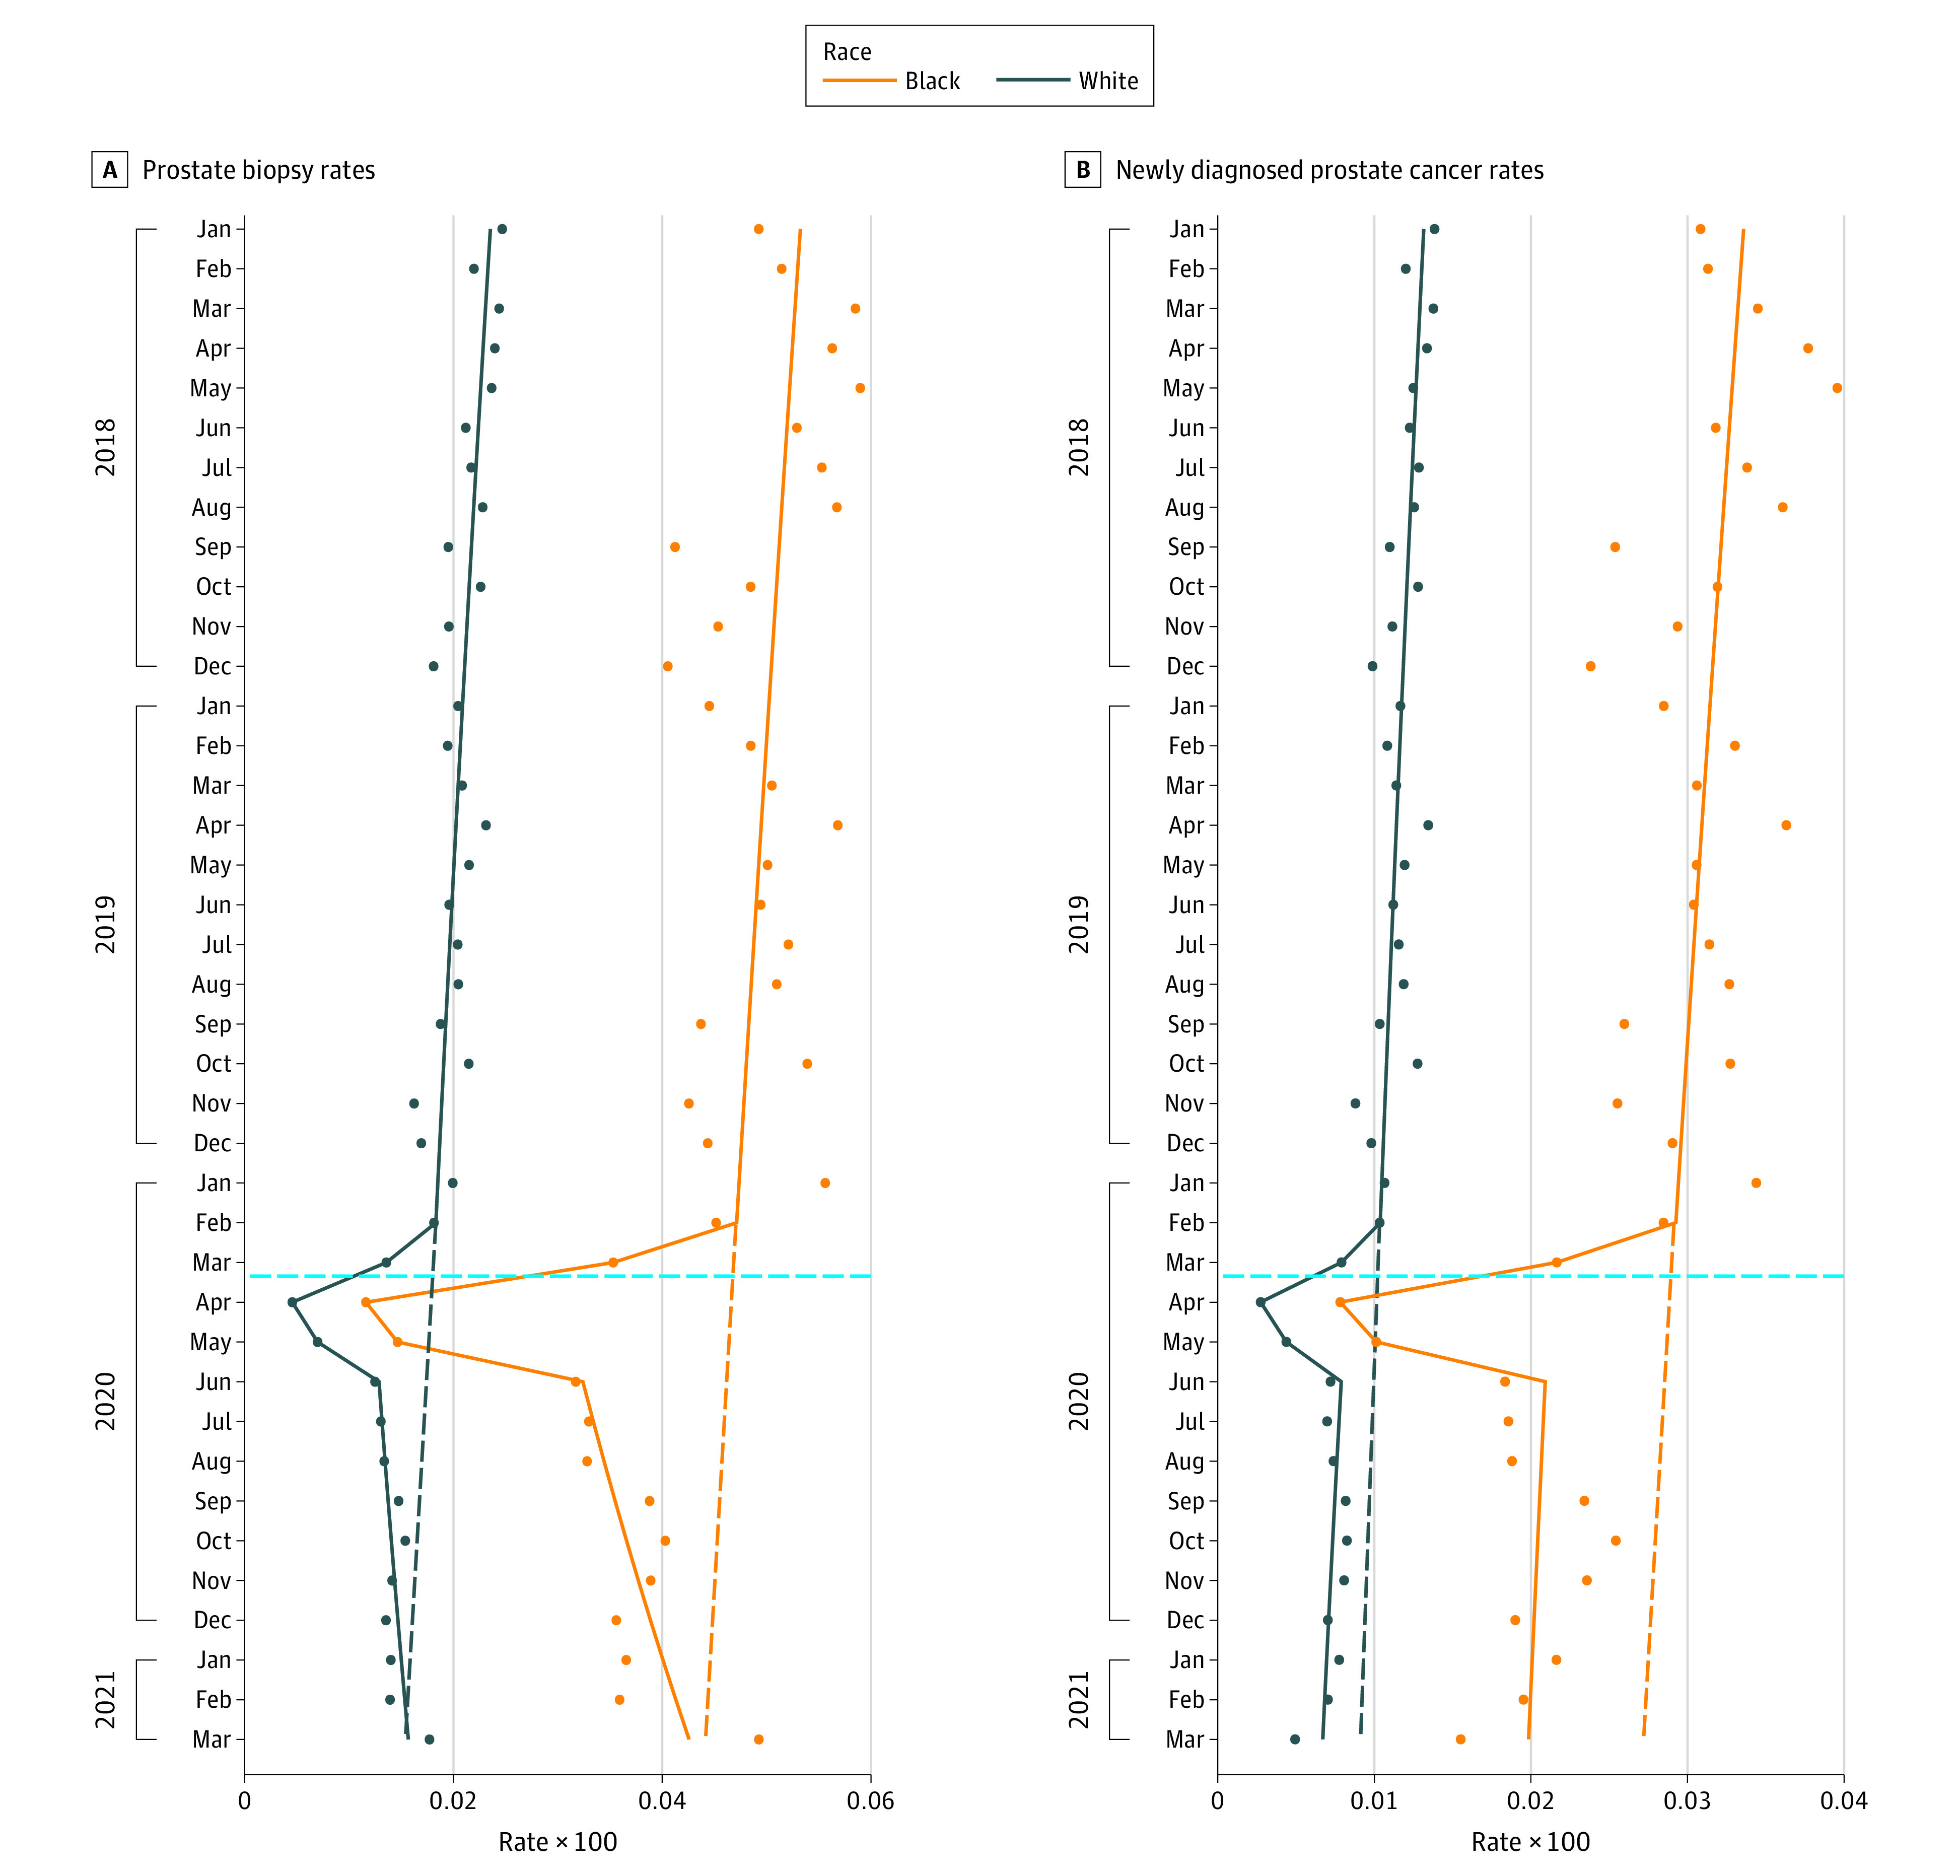
Figure 2. Prostate Biopsy Rates and Newly Diagnosed Prostate Cancer Rates Stratified by Race.

The solid lines represent the expected rates estimated by the interrupted time-series analysis; the dashed lines project the expected rates had there not been a COVID-19 pandemic interruption; the dots represent the observed rates of biopsies and prostate cancer diagnoses; and the horizontal dashed light blue line indicates March 11, 2020, when the World Health Organization declared COVID-19 a global pandemic.
