Figure 4.
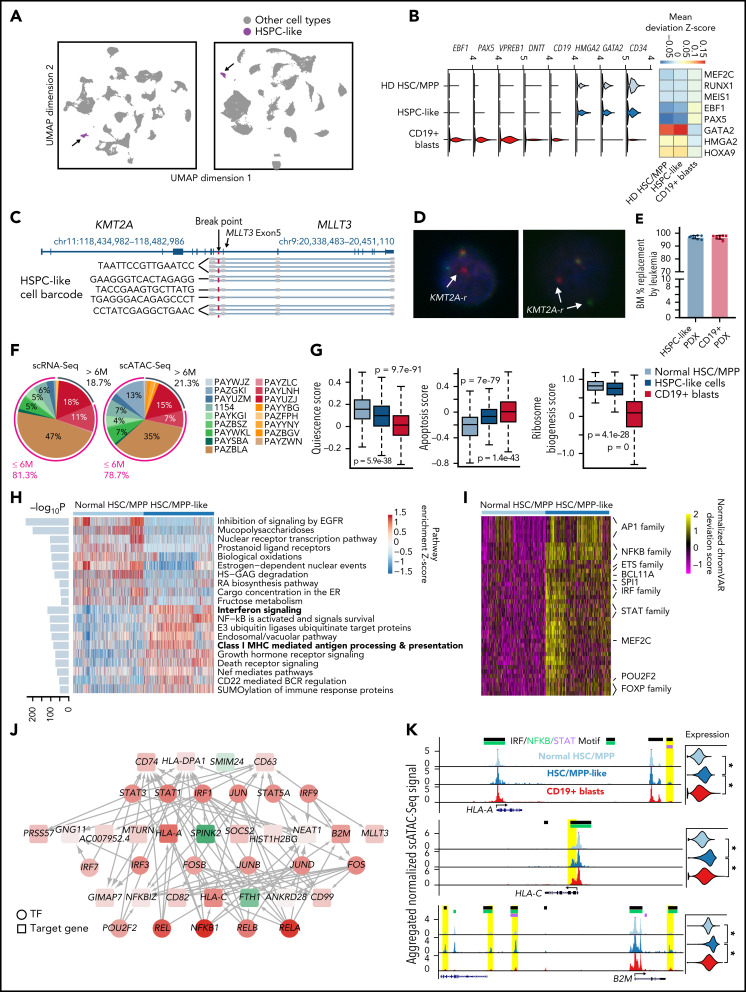
A leukemia cell containing HSPC-like population exists in younger patients. (A) UMAPs of single-cell data from the PB of 18 infant patients highlighting the hematopoietic stem and progenitor-like population in the PB of the patients (HSPC-like cells, purple). Gray, other cell types. Left panel, UMAP based on scRNA-Seq data, showing 128 588 total cells, 1136 of which are HSPC-like cells. Right panel, UMAP based on scATAC-Seq data, showing 98 887 total cells, 1020 of which are HSPC-like. (B) Gene expression and regulator activity signatures for normal HSPCs, HSPC-like cells, and CD19+ blasts. Left panel, violin plots of marker gene expression in the 3 cell types. Right panel, activity of cell-type-specific transcriptional factors in the 3 cell types. Activity was measured as the mean TF motif chromatin accessibility score in each cell type. (C) Representative result of fusion reads identified in HSPC-like cells from patient 1154 using scTLR-Seq. Fusion reads from multiple HSPC-like blasts (with different cell barcodes) are shown. (D) Representative DNA FISH images of HSPC-like cells. Blue, DAPI; red dots, 5′ of KMT2A gene; green dots, 3′ of KMT2A gene. White arrows indicate KMT2A translocation. (E) Barplot shows leukemia burdens (percentage of hCD45) in the end-of-study BM in 2 groups. Blue, PDX cells from HSPC-like engrafted mice (n = 8); red, PDX cells from CD19+ blasts engraft mice (n = 8). (F) Percentages of total HSPC-like cells contributed by each patient, based on scRNA-Seq and scATAC-Seq data. (G) Quiescence, apoptosis, and ribosome biogenesis signature gene scores for BM HSC/MPPs from normal donors, HSPC-like cells, and CD19+ blasts. Scores were calculated as the sum of z-scores (across all cells) of all genes of a signature. P values were computed using the Wilcoxon test. (H) Pathways enriched comparing HSC/MPP-like cells and BM HSC/MPPs from normal donors. Enriched pathways were identified using the AUCell method. Heatmap shows the top 20 enriched pathways for HSC/MPP-like cells and normal HSC/MPPs, respectively. Barplot on the left shows the adjusted P value for enrichment. (I) Heatmap of differential TF motif accessibility in HSC/MPP-like cells compared with normal BM HSC/MPPs. Values are z-score normalized deviation scores calculated using chromVAR. TFs with differential accessibility between HSC/MPP-like cells and normal HSC/MPPs were identified using Wilcoxon test of the normalized deviation scores between the 2 groups with an FDR cutoff <0.05. (J) Transcriptional regulation network distinguishing HSC/MPP-like cells from normal HSC/MPPs. For clarity, only the part of the TRN involving AP-1, NFKB, STAT, and IRF factors is shown. Nodes represent either enriched TFs or differentially expressed genes in the HSC/MPP-like blasts vs normal HSC/MPPs. Node color is proportional to the −log10(FDR) of differential expression, with red being upregulation and green being downregulation. Edge line thickness is proportional to the −log10(FDR) of the linear regression coefficient for the predicted enhancer-promoter interaction. (K) Example MHC class I genes upregulated in HSC/MPP-like cells. Left panels, aggregated scATAC-Seq signals in normal HSC/MPPs, HSC/MPP-like cells, and CD19+ blasts. Putative enhancers for each gene are highlighted in yellow. Motifs of STAT or NFKB or IRF transcription factors overlapping the enhancers are indicated at the top. Right panels, violin plots for normalized expression of the selected genes in the 3 cell types. *Adjusted P value <1e-10.

