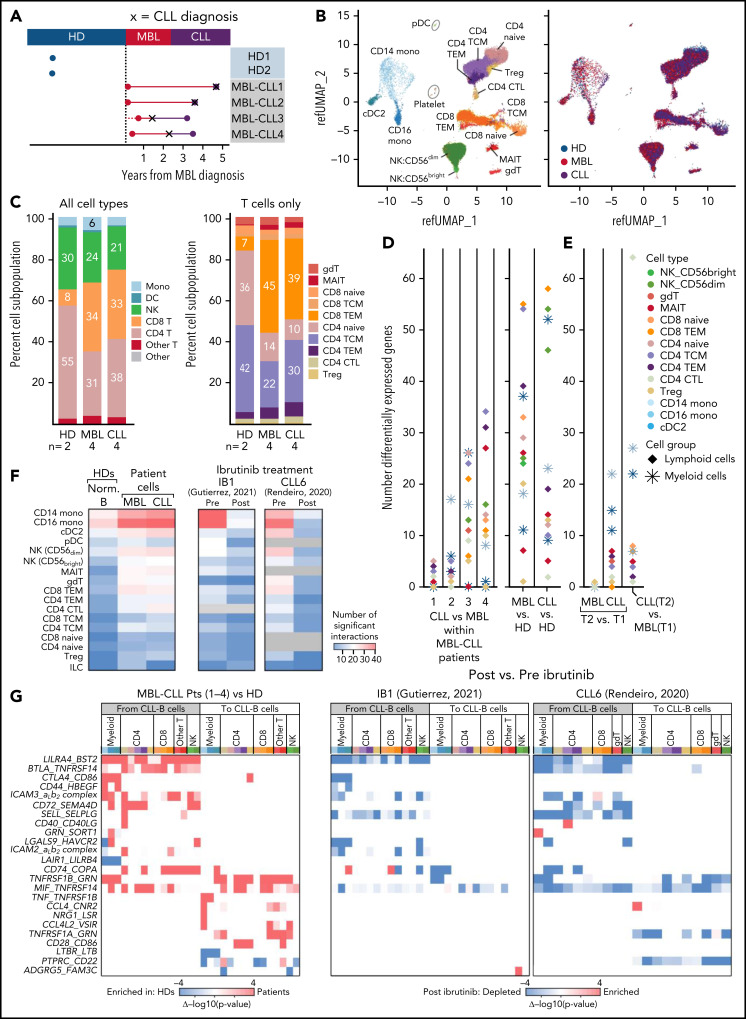
Figure 2.
scRNA-seq analysis of immune cells from healthy donors and disease progression from MBL to CLL. (A) scRNA-seq was performed on PBMCs collected from 4 patients with MBL (red dots) that progressed to CLL (purple dots), and from 2 HDs (blue dots). X, the time of diagnosis of CLL. (B) UMAP visualization of all immune cells colored by immune cell types (left) and by sample types (right). (C) Proportion of immune cell types (left) and T-cell subtypes (right). (D) Number of significant differentially expressed genes for each cell type by performing a comparison of paired samples within patients (left) or comparison between MBL samples or CLL samples vs healthy donors (right). Cells were categorized based on lymphoid and myeloid cells. (E) Same analysis for significant differentially expressed genes was performed on 3 independent patients with nonprogressive MBL and 7 with CLL (Figure 1). (F) Heat maps with the number of the significant ligand-receptor interactions for each cell type under different conditions using CellPhoneDB v2.1.7. Heat map comparing the number of significant interactions between healthy donors and patient samples from either MBL stage or CLL stage (left). Heat maps including samples before and after ibrutinib for 2 additional patients (right).20,21 Gray boxes indicate an insufficient number of cells to perform interactome analysis. (G) Heat maps representing the difference of P values for each ligand-receptor pair regarding specific cell types (x-axis). Interactions that are enriched in patients (red) or enriched in healthy donors (blue) were calculated by subtracting −log10 (P value) in healthy donors from −log10 (P value) in patients (left). The same interactions that are either enriched (red) or depleted (blue) after ibrutinib (right)20,21 are calculated by subtracting −log10 (P value) in preibrutinib from −log10 (P value) in postibrutinib. Pts, patients; cell type abbreviations are the same as in Figure 1.

