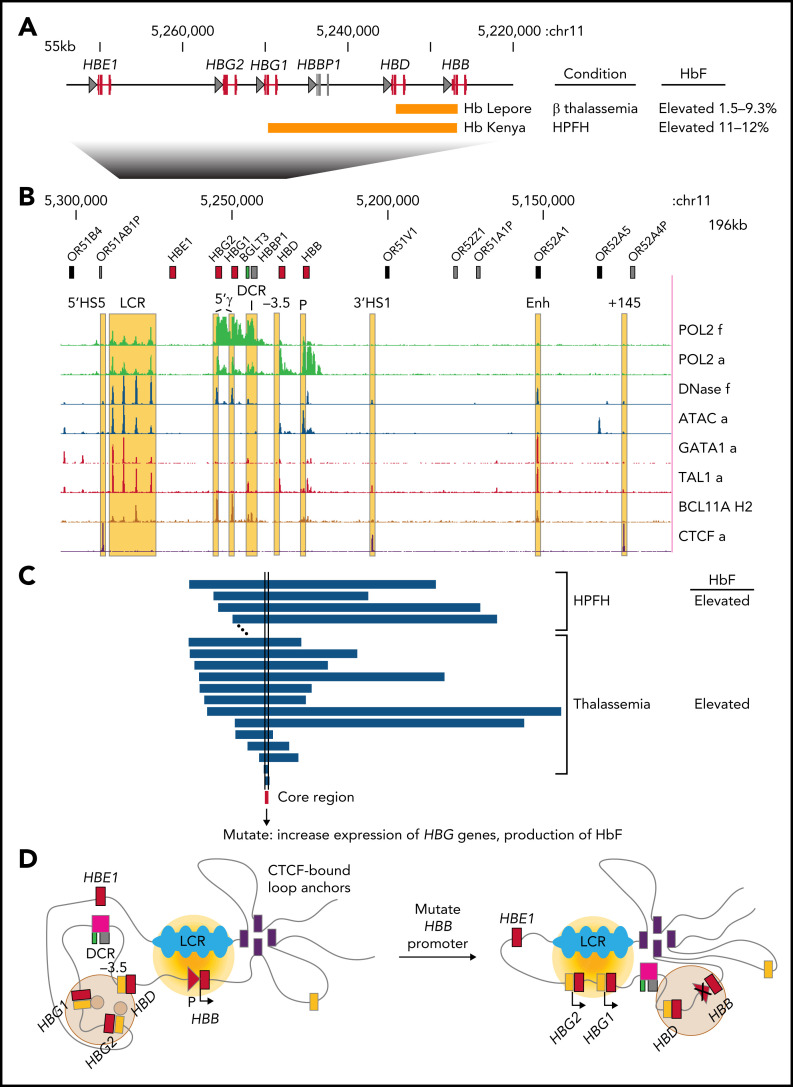
Activation of fetal HBG genes by disruption of the HBB promoter supports a model of promoter competition for an enhancer for switching in gene expression. (A) The globin genes within the HBB cluster are shown with rectangles for exons (red for genes encoding globins, gray for the pseudogene) and triangles for promoters. The genomic intervals deleted to form fusion genes are indicated as orange rectangles, along with phenotypes in individuals. The interval chr11:5,220,001-5,275,000 in assembly GRCh38 is shown in reverse orientation so that genes are arranged 5′ to 3′ left to right. HBE1 encodes the embryonic ɛ-globin; other gene symbols are defined in the text. (B) An expanded view of the HBB cluster includes surrounding olfactory receptor genes (OR), with genes shown as single rectangles (all are in the same orientation). Selected regulatory (LCR, 5′γ indicating sites immediately upstream from the HBG genes, differential contact region [DCR], −3.5 for an element upstream of HBD,8 P for HBB promoter, and Enh) and structural (CTCF-bound 5′HS5, 3′HS1, +145 sites) elements are marked by yellow underlays for the sequence-based signal tracks of epigenetic features, including occupancy by RNA polymerase II (POL2) in fetal (f) and adult (a) erythroblasts, chromatin accessibility to DNase or transposase (Assay for Transposase-Accessible Chromatin [ATAC]), and occupancy by GATA1, TAL1, and CTCF in adult erythroblasts and BCL11A in HUDEP-2 cells. The genomic interval shown is chr11:5 109,001-5,305,000 in reverse orientation. (C) The intervals deleted in several alleles associated with HPFH or thalassemia (from the HbVar database) are shown as blue rectangles in register with the features shown in panel B; these are a subset of the deletions studied in Topfer et al. A browser session with the tracks shown in panels B and C allows further exploration and gives links to references and further information (https://main.genome-browser.bx.psu.edu/cgi-bin/hgTracks?hgS_doOtherUser=submit&hgS_otherUserName=ross&hgS_otherUserSessionName=BloodCommentary_Crossley and http://usevision.org). (D) A model for competition between the promoters for the adult HBB gene and the fetal HBG genes for activation by proximity to the LCR enhancer (blue lobes), encompassing chromatin interaction results from multiple sources.1,3,8 The diagram indicates the shift in promoter interactions with the LCR enhancer upon disruption of the HBB promoter. The brown disks on the 5′γ elements represent BCL11A, the gold gradient represents a zone of high transcriptional activity centered on the LCR, the light brown disk represents a repressive zone, and the gray line represents DNA.

An official website of the United States government
Here's how you know
Official websites use .gov
A
.gov website belongs to an official
government organization in the United States.
Secure .gov websites use HTTPS
A lock (
) or https:// means you've safely
connected to the .gov website. Share sensitive
information only on official, secure websites.
