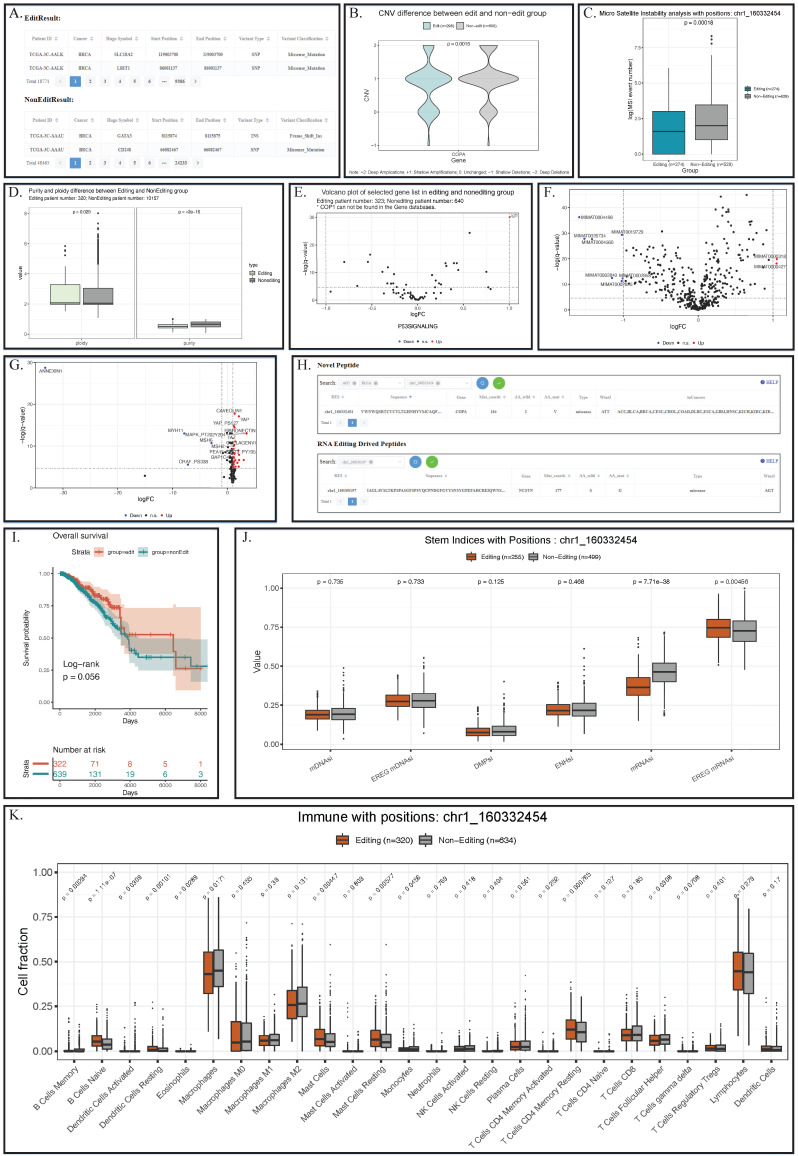
Figure 4.
Analysis result of editing and non-editing groups in the example of COPA I164V in BRCA. (A) Somatic mutation results indicated some mutations that appear specifically in patients with COPA I164V event in BRCA. (B) Violin plots showing the CNV levels of COPA between COPA I164V editing and non-editing group across BRCA. (C) Boxplot of microsatellite instability between editing and non-editing group patients in BRCA. (D) Barplots of Tumor purity and ploidy in the patient group with and without COPA I164V event in BRCA. (E) Volcano plot indicated that the expression levels of IGF-1 in the P53 signaling pathway of the editing group patients were significantly higher than those in the non-editing group. (F) Landscape of differentially expressed miRNA between BRCA editing and non-editing group patients. (G) Landscape of differentially expressed proteins between COPA I164V editing and non-editing group in BRCA. (H) Novel peptides resulted from COPA I164V. (I) Survival analysis comparing the overall survival of BRCA patients with and without COPA I164V editing events. (J) Boxplot of six stem indices between two group patients. (K) Barplots showing differentially infiltrated immune cells between editing and non-editing group in BRCA.

